Want a quick overview?
About the project
The recycling and repurposing of PC computer parts is a current challenge in our society. PC gamers made up 24% of the entire market share of online gamers in 2019. Is there a cost-effective way to get control over the ubundance of parts that are no longer needed?
My contribution
Low/Medium/High fidelity prototypes
Survey creation and interview preparation
Analysis of data collected using affinity diagraming
Brainstorming and ideation for product development
Design evaluation using specific methods to get the best information possible
What did I learn?
Engaging in meaningful conversations with end users during this project has taught me the invaluable lesson that their perspectives and feedback are crucial for creating user-centric solutions, enabling me to craft designs that truly resonate, solve problems, and enhance user experiences.
Here's a brief summary that takes only one minute to read
Phase 1: Research
During the initial research, we assessed existing literature that talked about common characteristics of gamers. However, articles that focus on gamers’ sustainable habits are limited. Therefore, we used online forums and resources that provided a more detailed understanding of how the PC gaming community manages outdated or damaged computer parts.
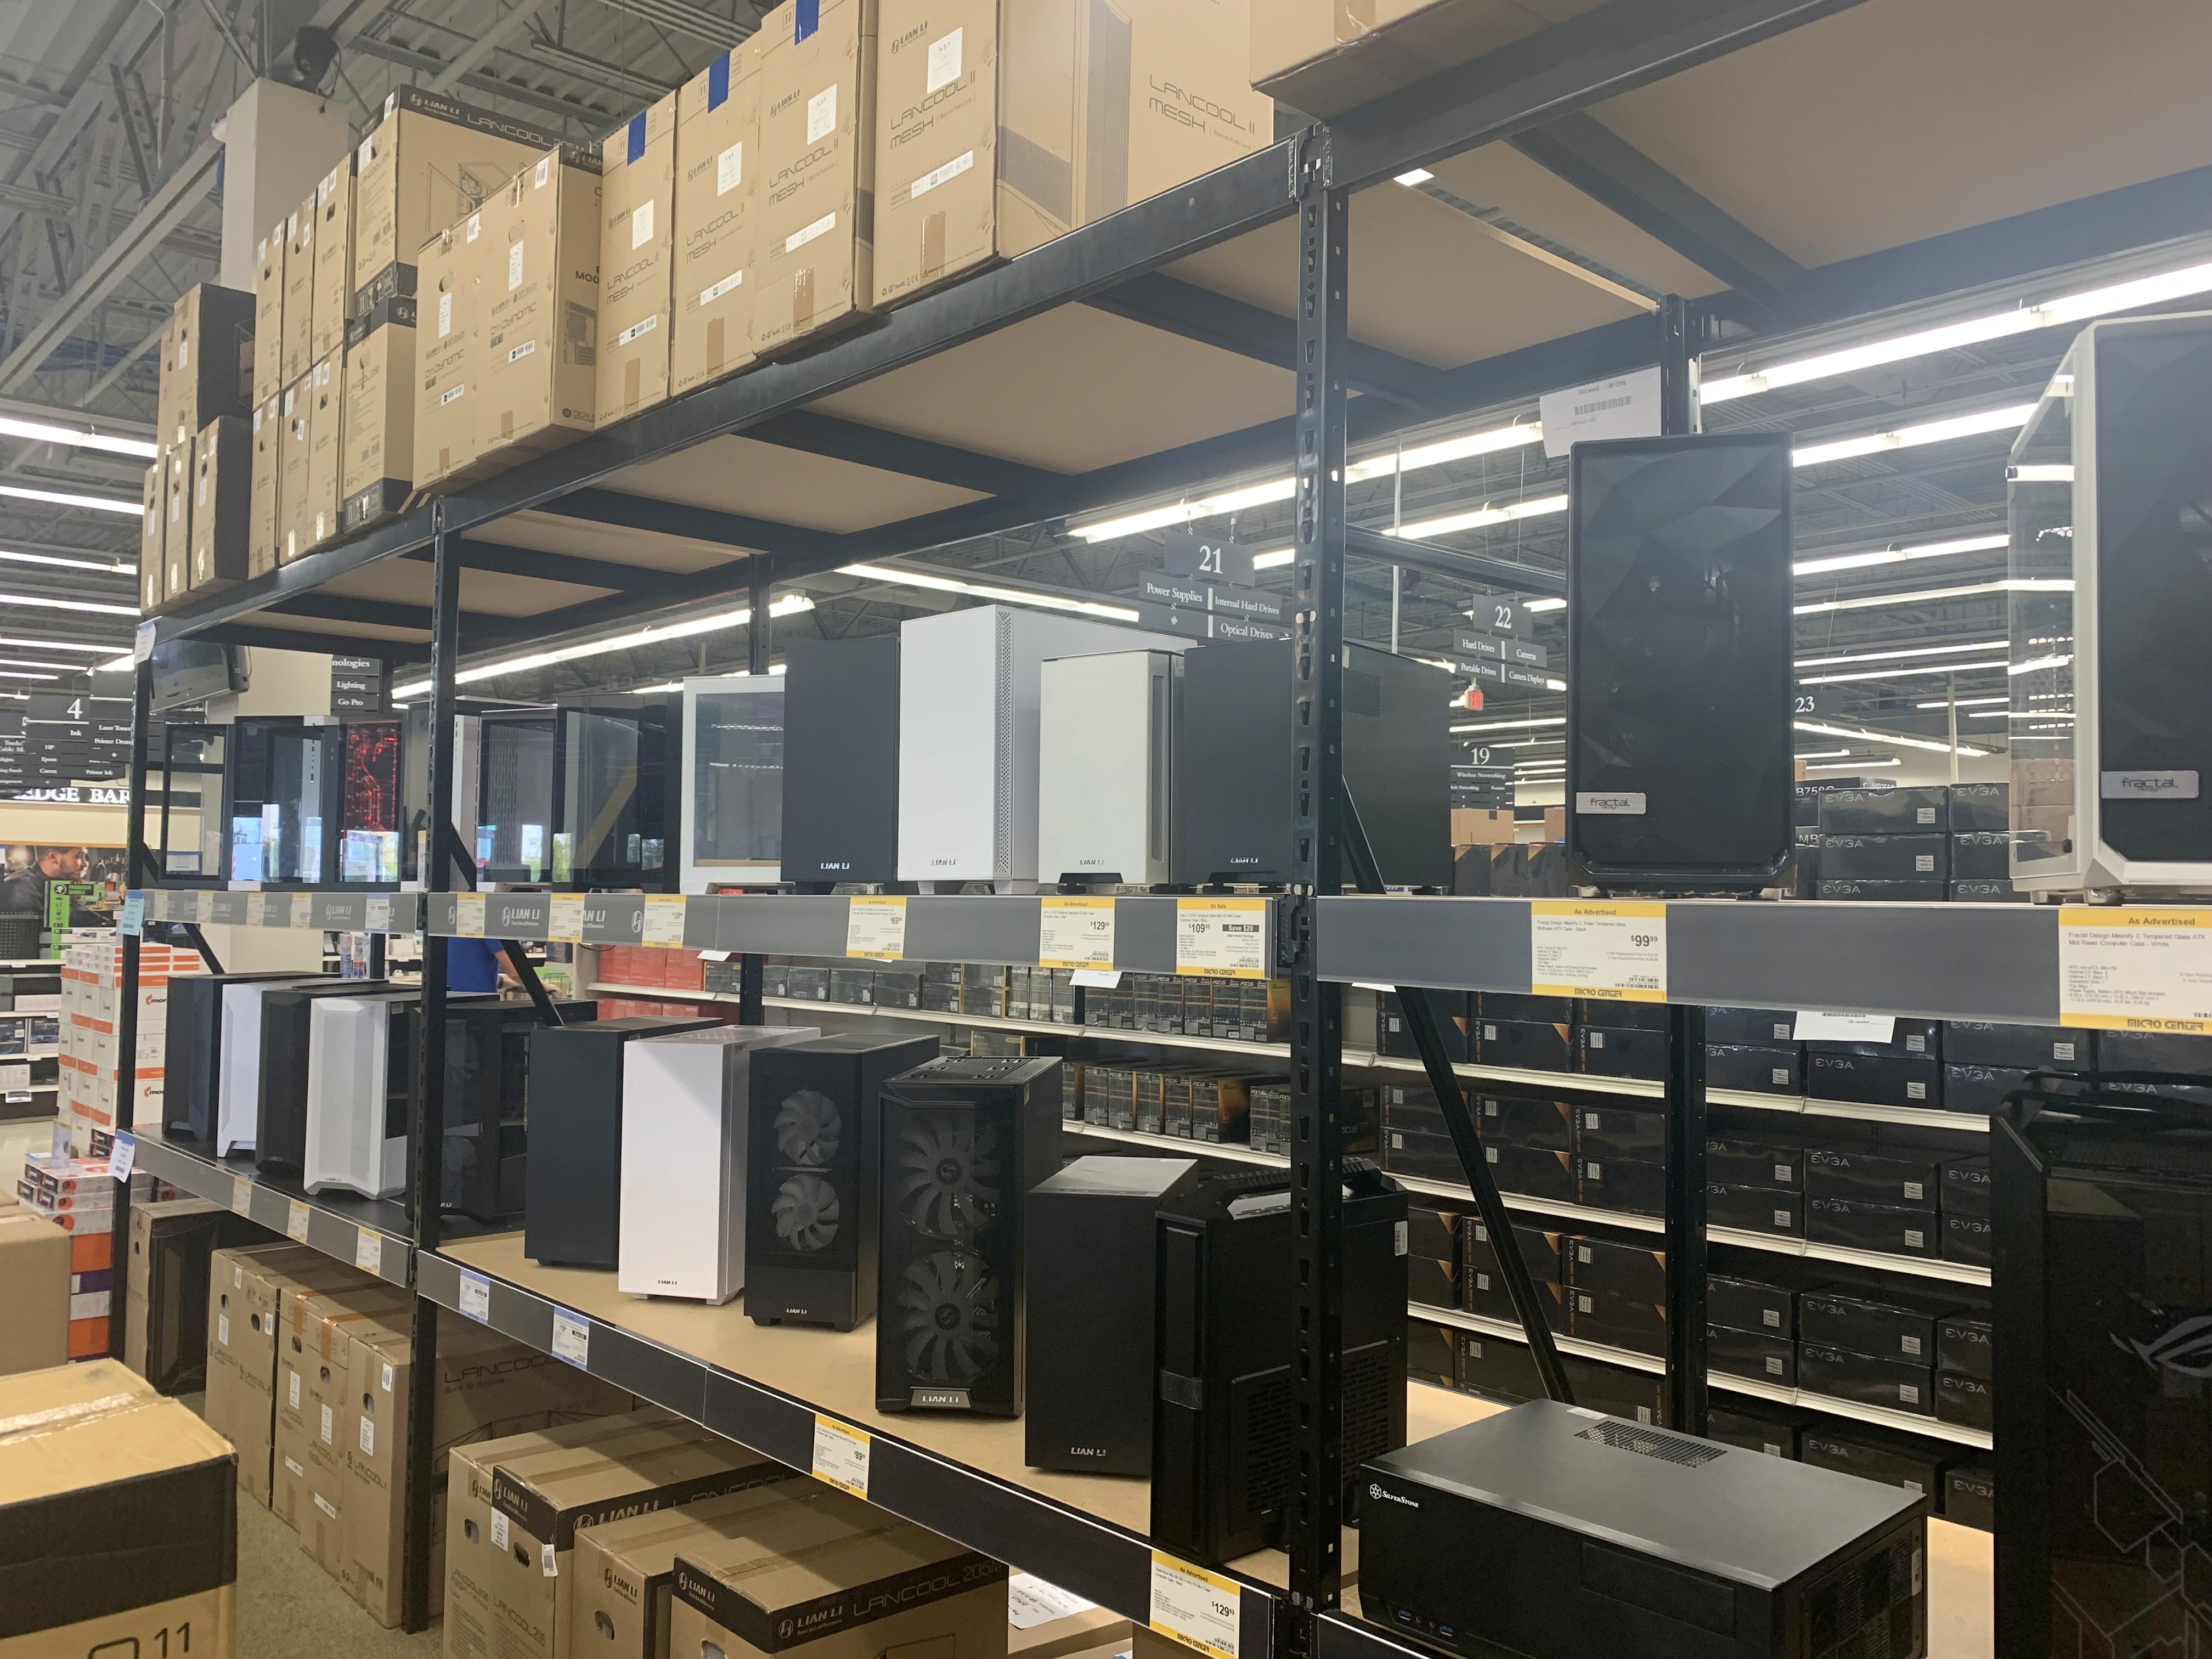
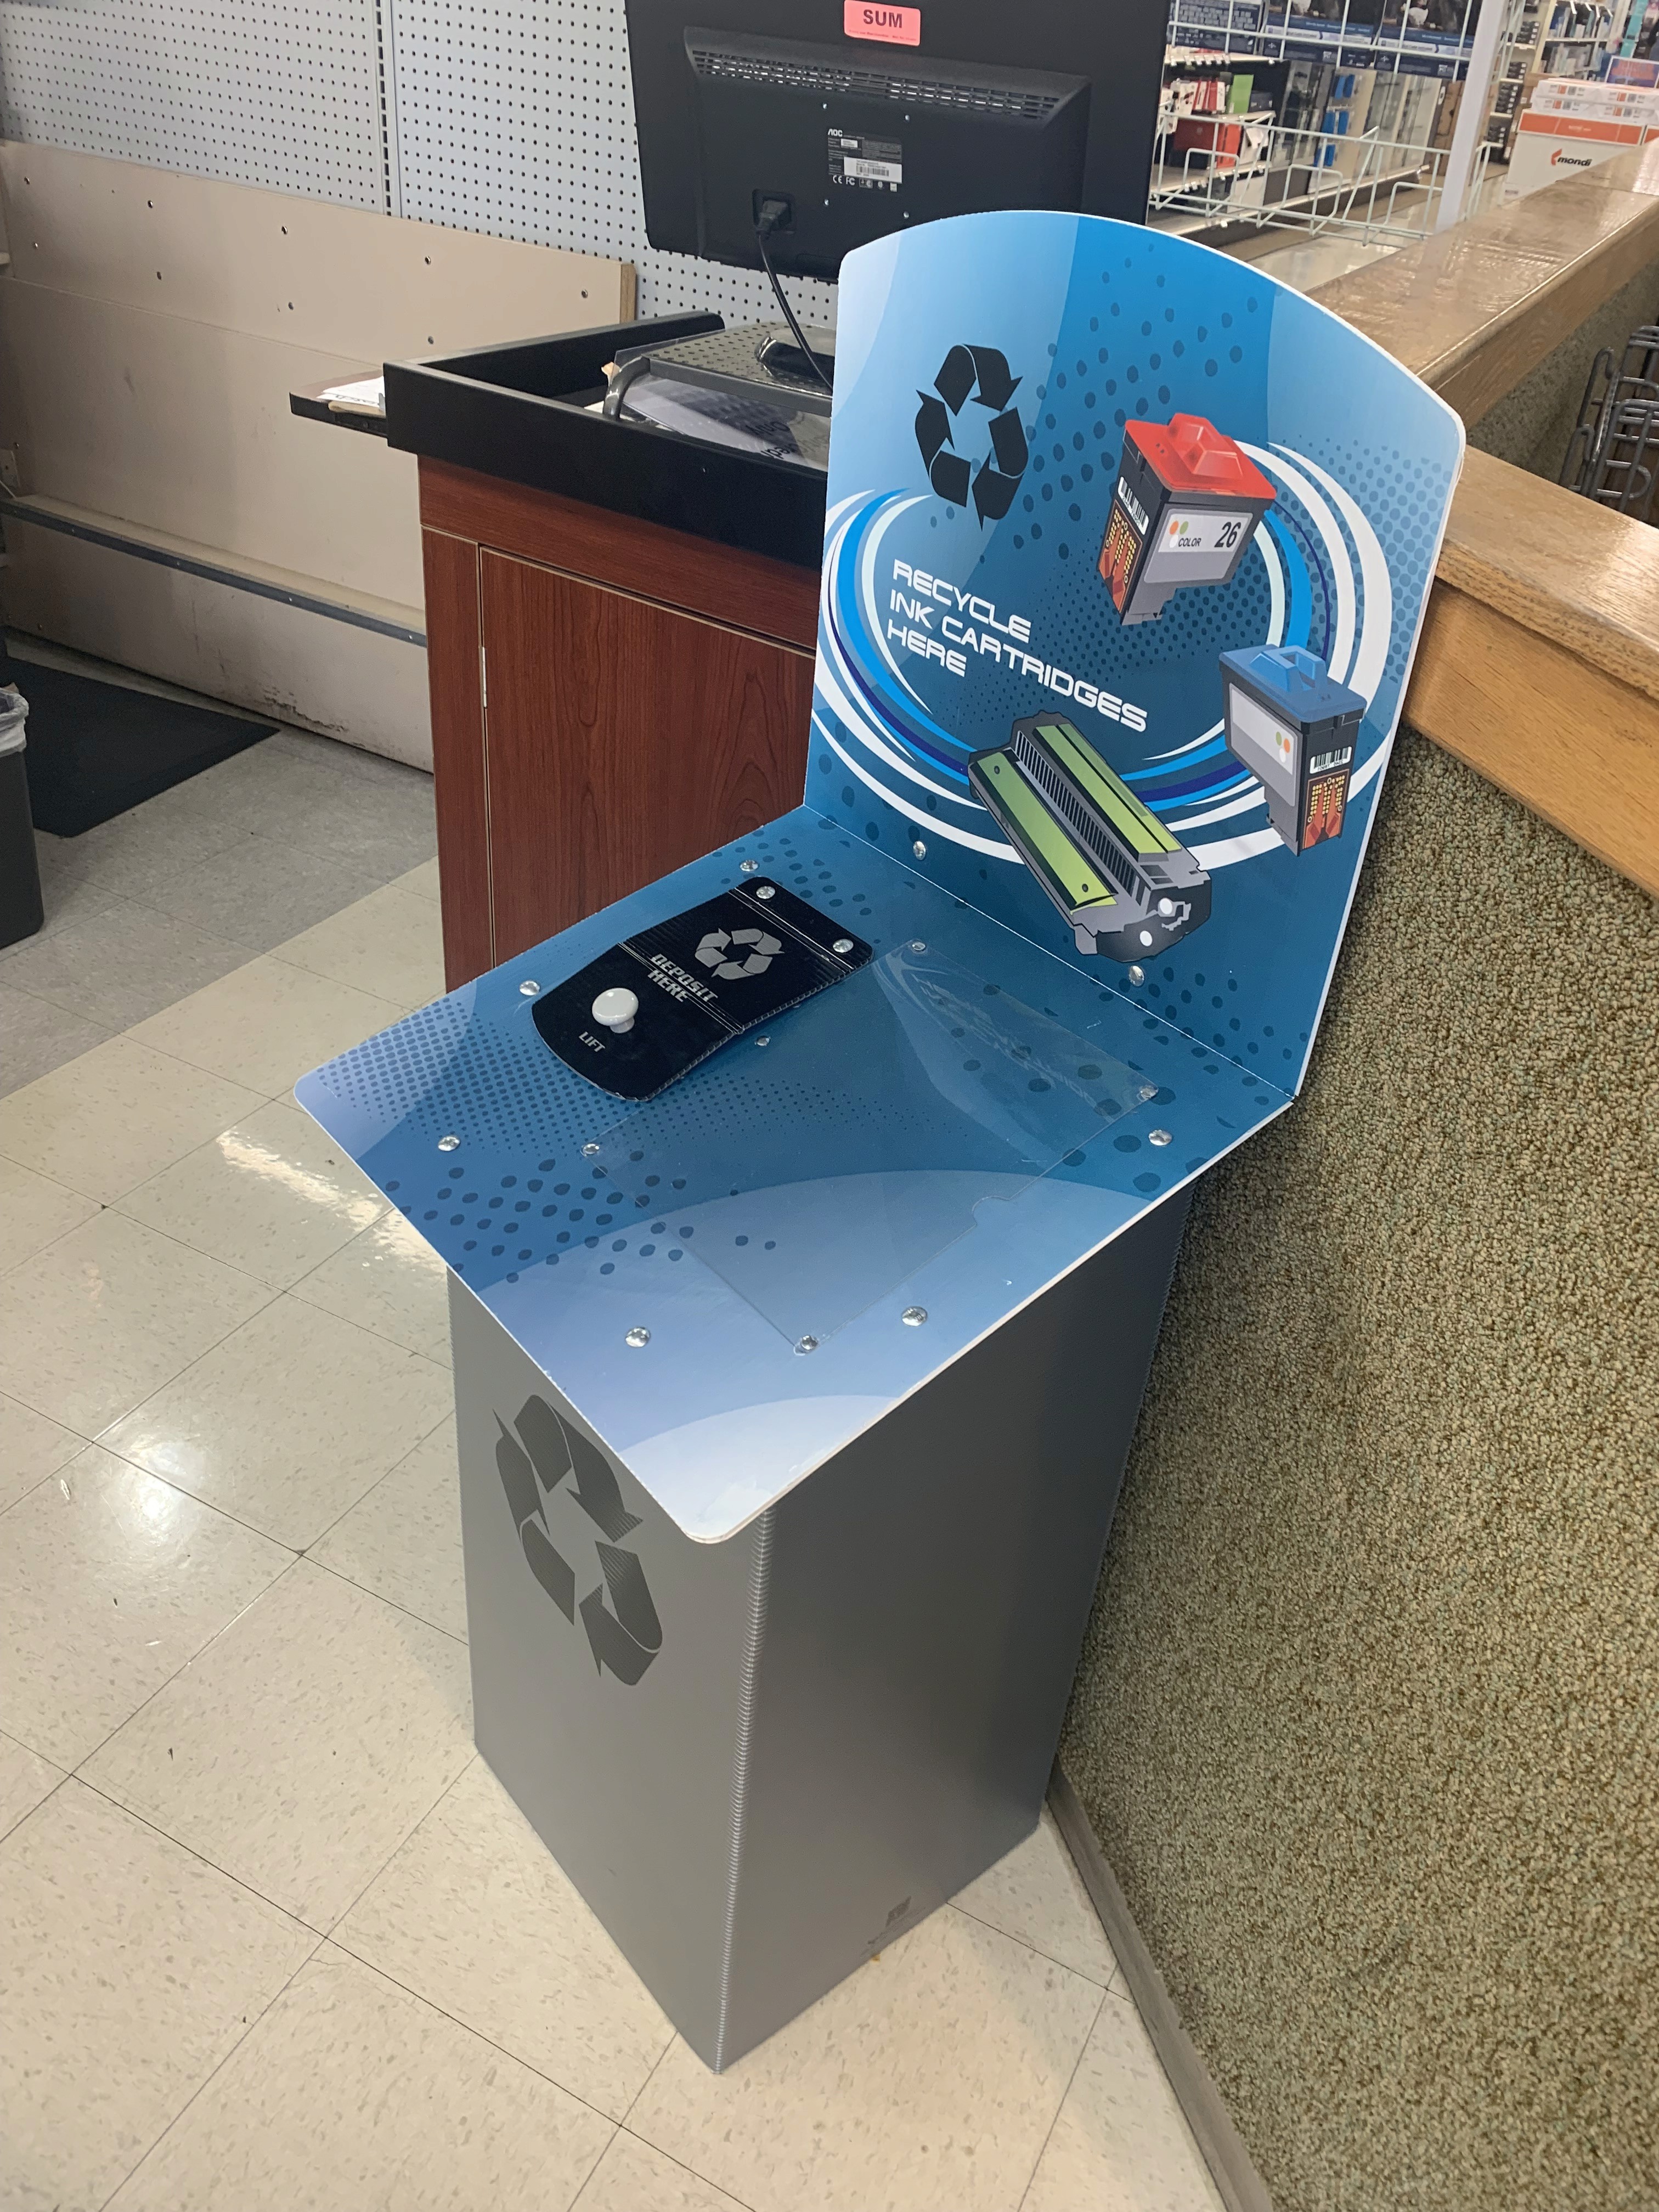
To gather more hands-on information, we conducted additional research by visiting electronic equipment stores around the Atlanta area such as Micro Center and Best Buy to understand recycling and electronic waste management policies. Additionally, we conducted an initial interview with a member of our target user group who is a member of the e-sports club at an Atlanta university.
The information gathered during this interview provided greater insight into understanding PC gamers’ recycling habits. We continued to explore our user groups problem through surveys, contextual inquiries, and interviews.
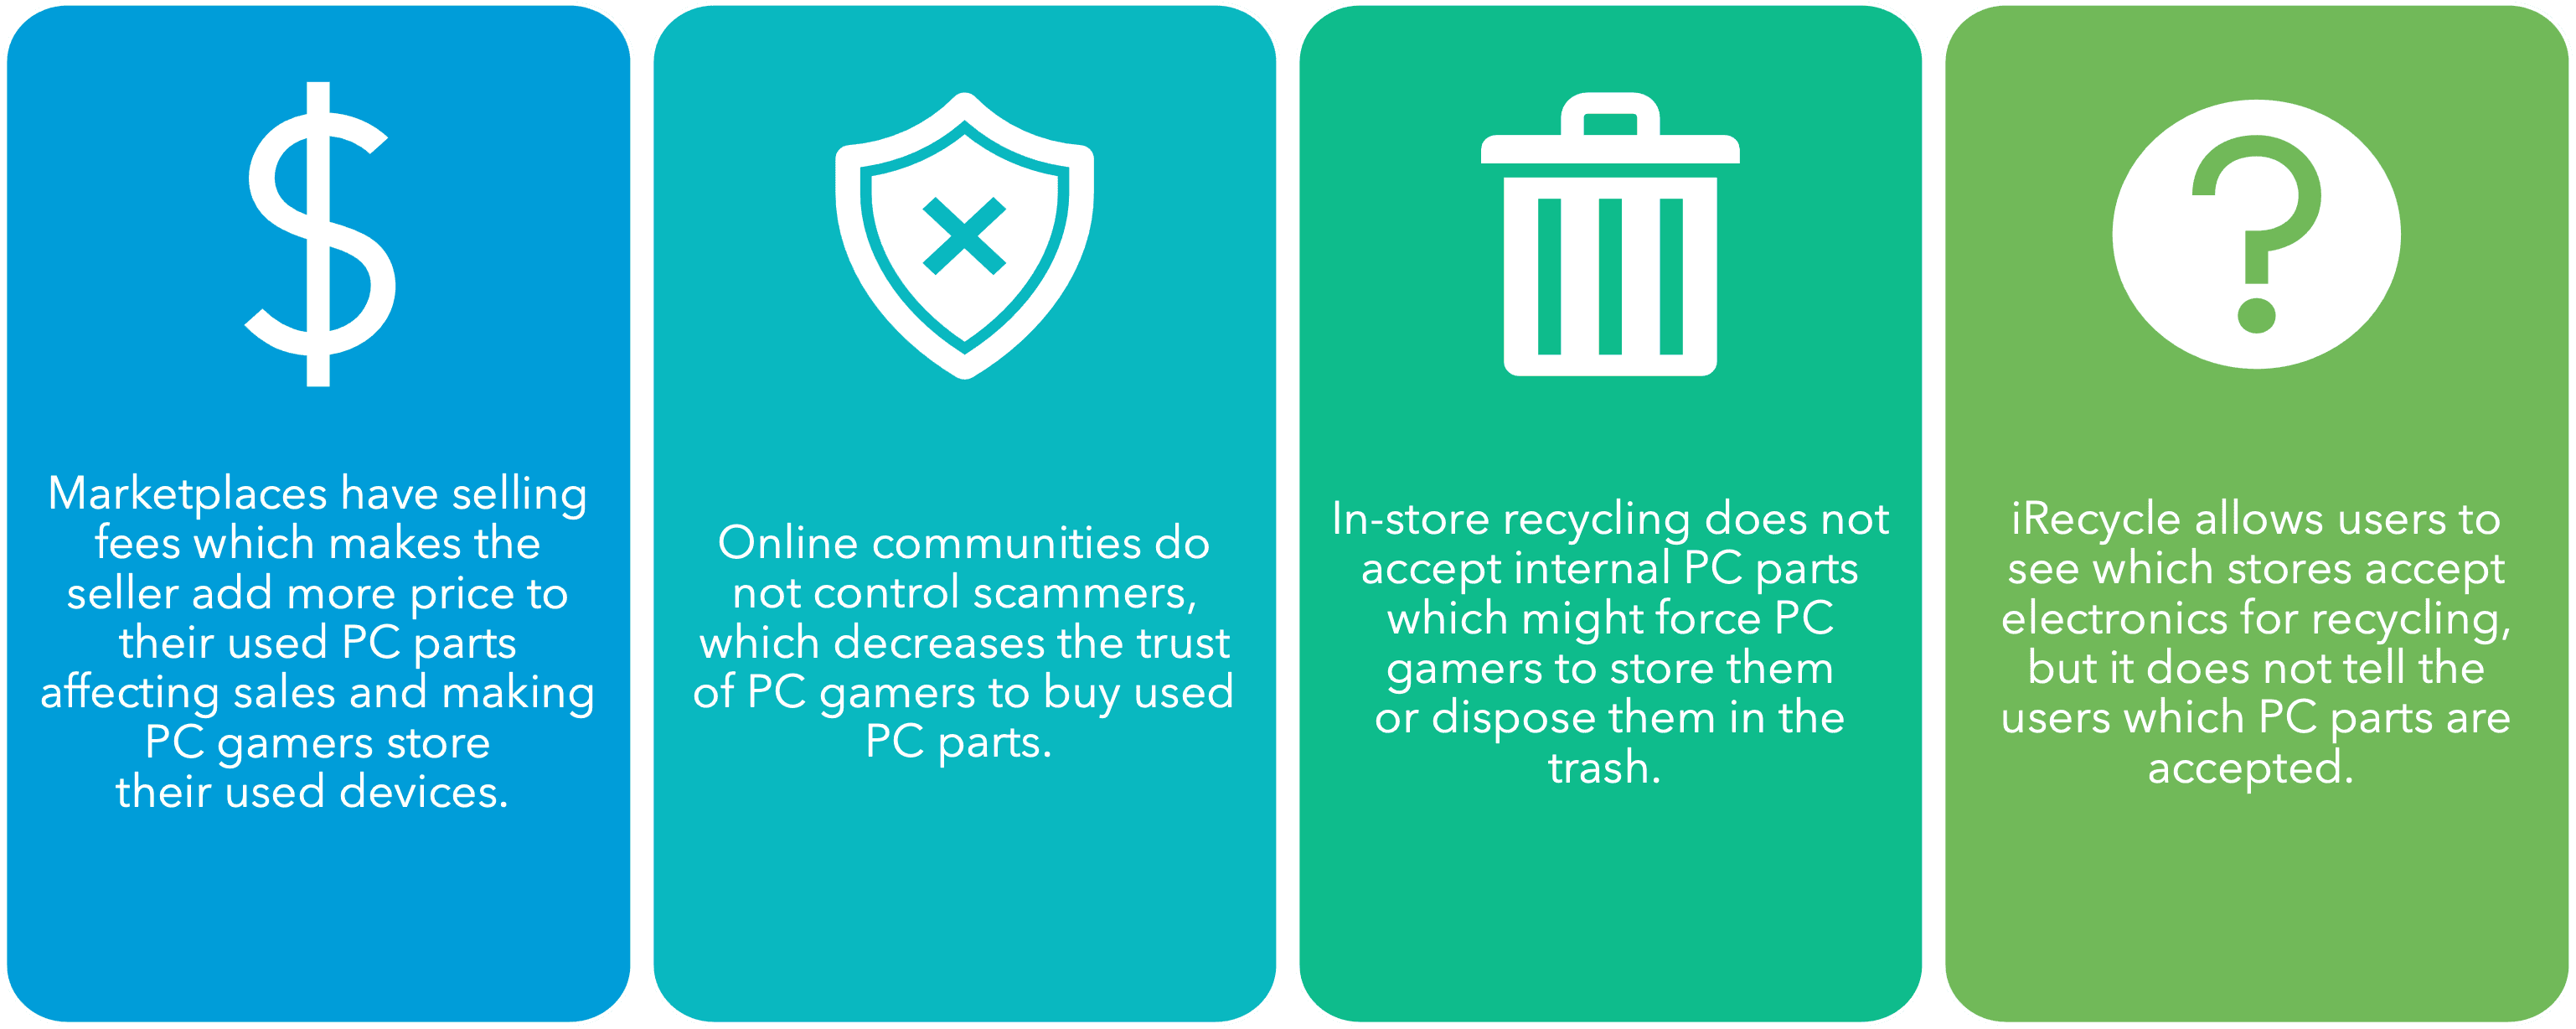
Competitive analysis
Goal
To understand how different electronics stores currently take care of e-waste.
Method
We investigated electronic stores’ websites, marketplaces, Reddit forums, and current electronic recycling apps.
Survey distribution
Goal
Gain information about PC gamers demographics and recycling, reusing, and disposal habits while screening and recruiting interview participants.
Method
We developed a 20 question survey using Qualtrics XM and distributed it onto five Discord servers.
Data analysis
We received 90 responses within seven days of distribution. Out of the 90 respondents, only 81 of them responded that they have built a gaming PC, we only counted their responses for the rest of our analysis.
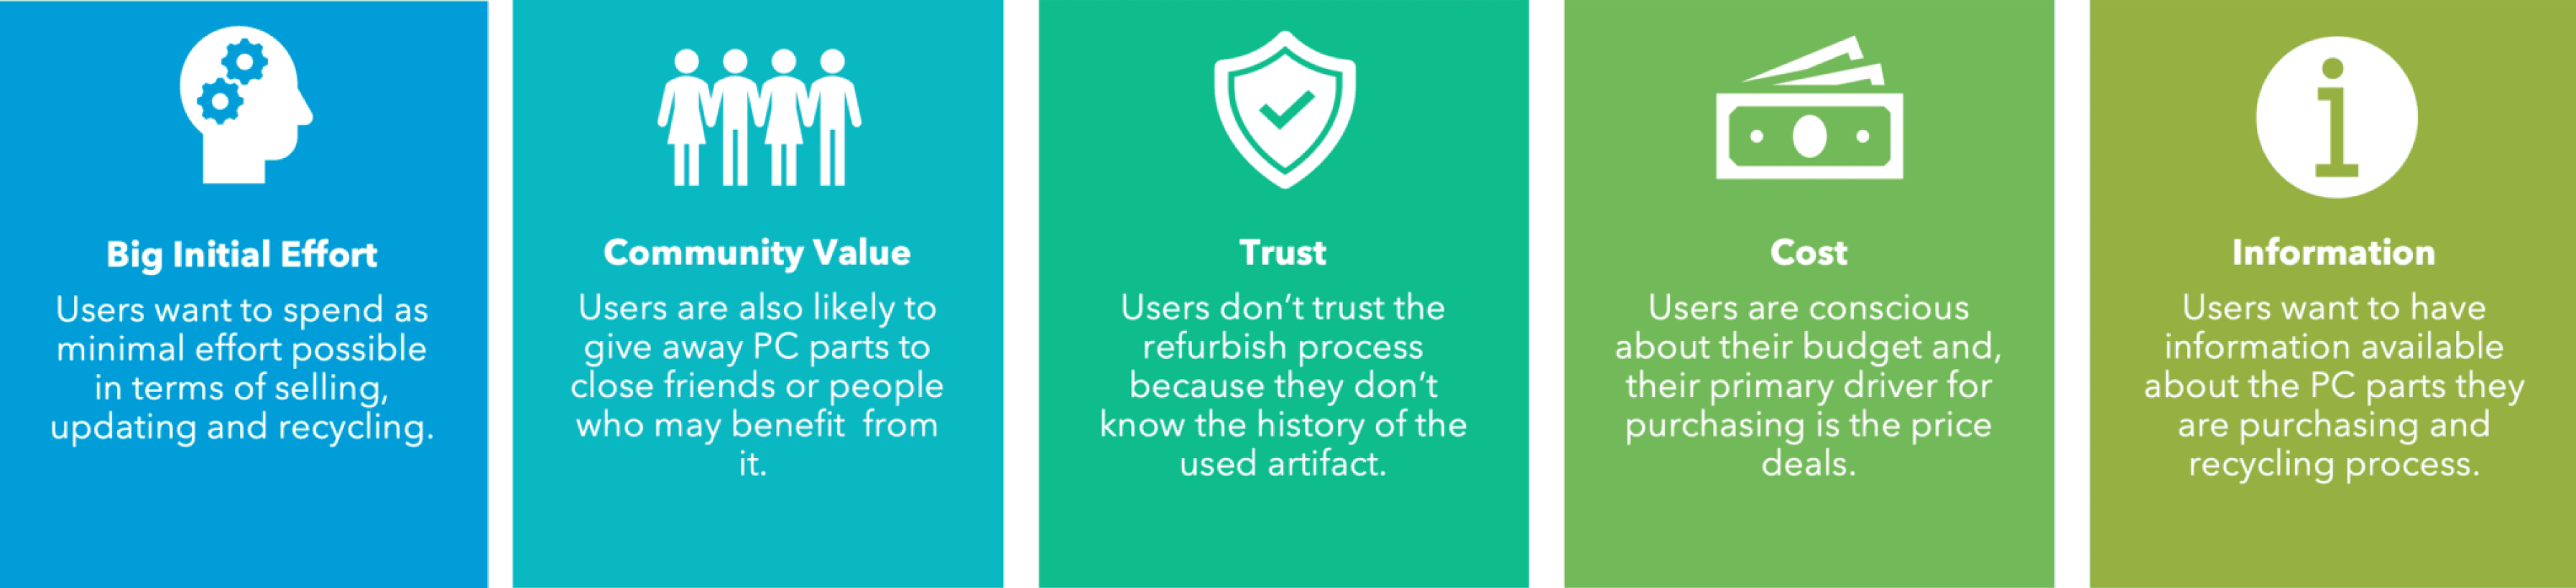
Findings
The majority of respondents indicated that they store the PC parts they don’t need instead of selling, reusing, or recycling them.
More than 50% of our respondents indicated that they bought their PC parts online.
More than half of respondents prefer to buy new PC parts instead of refurbished ones.
Semi-structured interviews
Goal
Understand users’ attitudes and behaviors towards the process of getting rid of PC parts they no longer need.
Method
Semi-structured interview will allow us to ask follow-up questions to get a deeper understanding of their pain points and other insights.
Data analysis
To perform the affinity mapping activity, we entered our interview notes and transcripts into a spreadsheet. Then, we added them to Miro board and created an affinity diagram. Individually, we walked the wall and brainstormed design ideas, then came back together to discuss further implications.
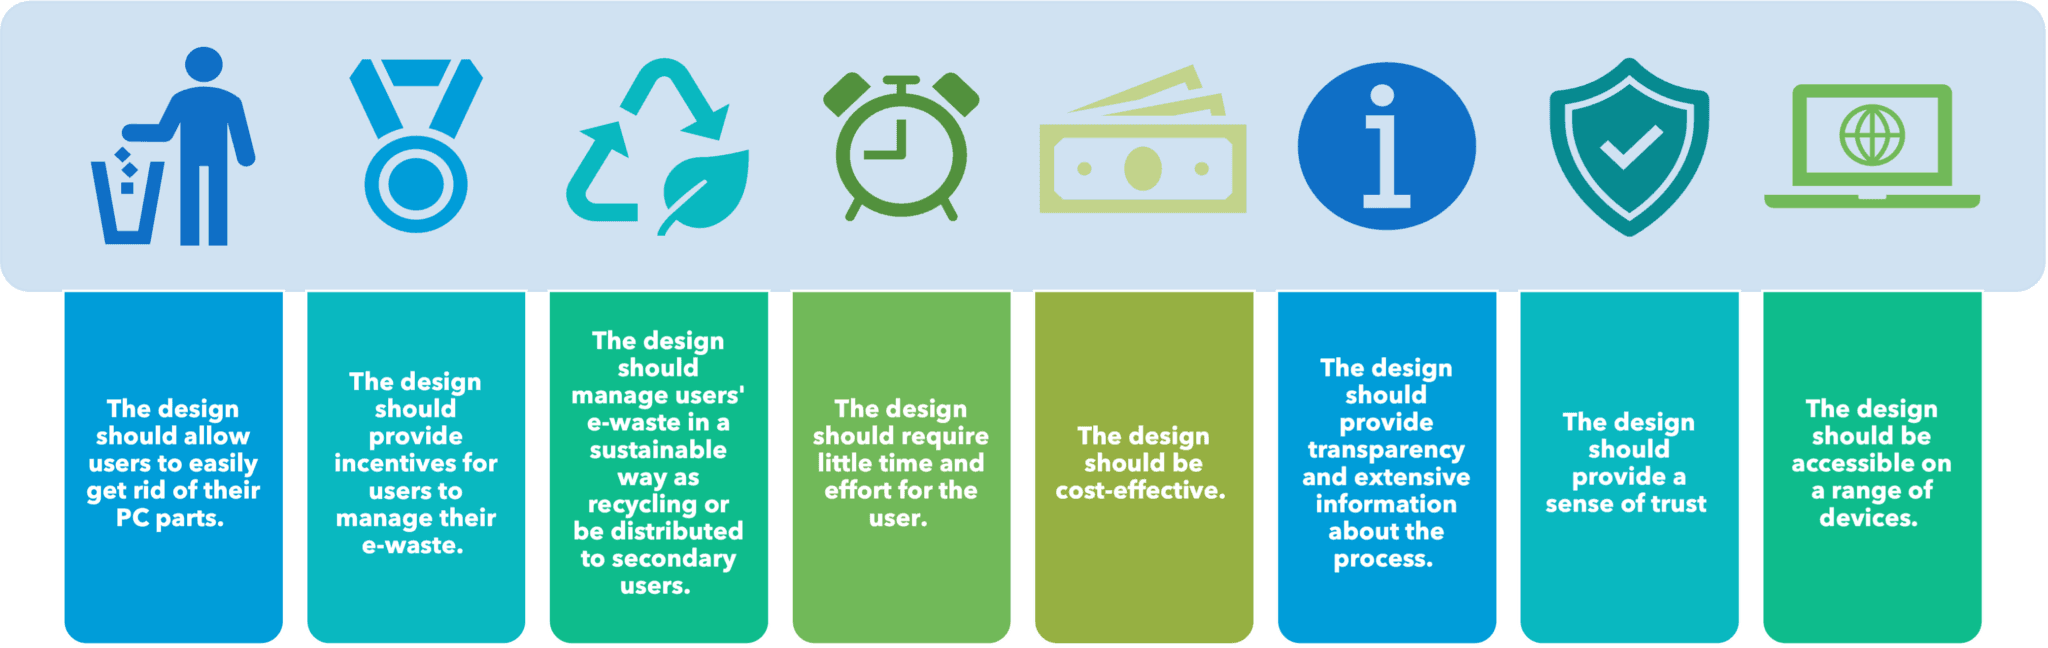
Phase 2: Design Requirements
Based on our research findings and insights, we came up with eight design requirements for our prototype:
Phase 3: Prototype Design
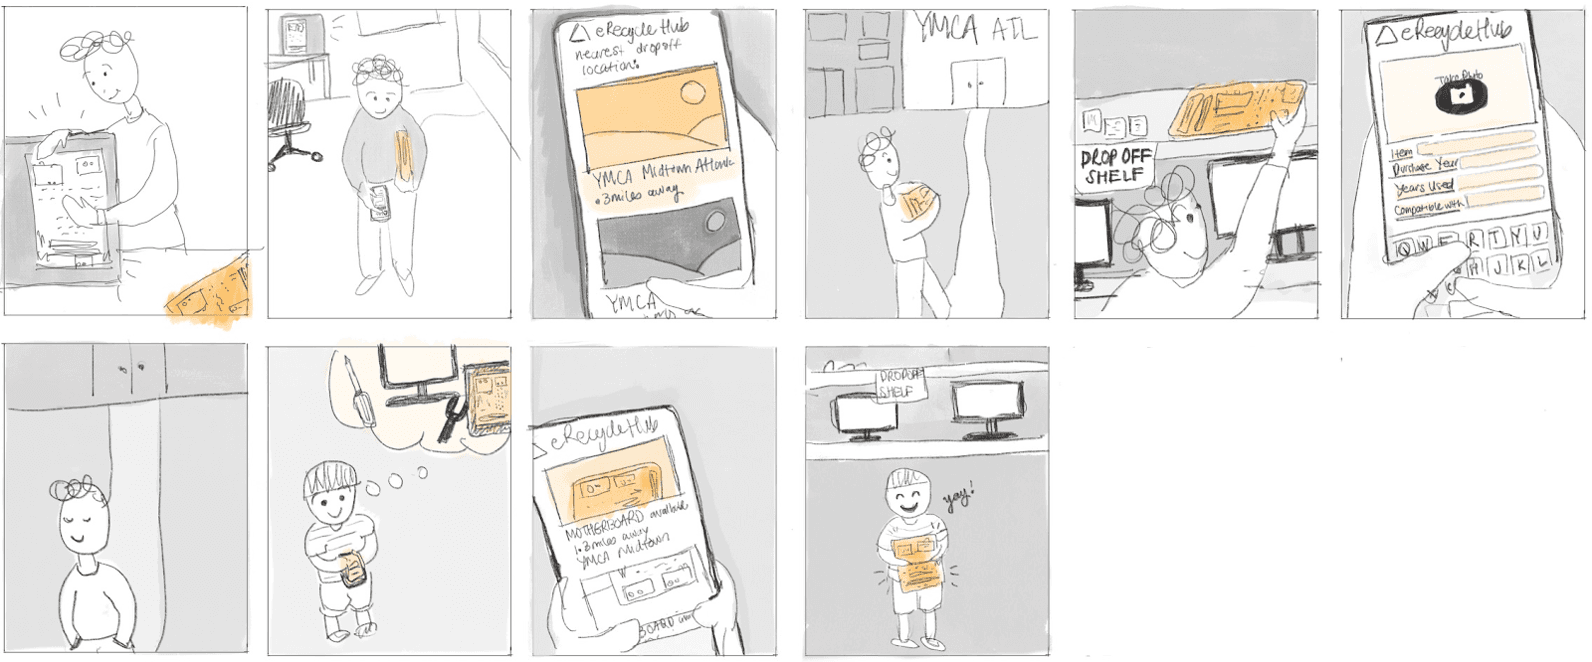
Design ideation
During our brainstorming activities, we utilized methods such as SCAMPER and Mind Mapping to create ten unique ideas to discuss further. The main idea chosen was eCycle Hubs. We created a storyboard to show the path a user would take via a comic strip style graphic.
High fidelity prototypes
For our high fidelity prototype, we created three processes that the user would perform based on what they are trying to accomplish at the community center. Each process is listed below with a brief description and a button to the Figma prototype.
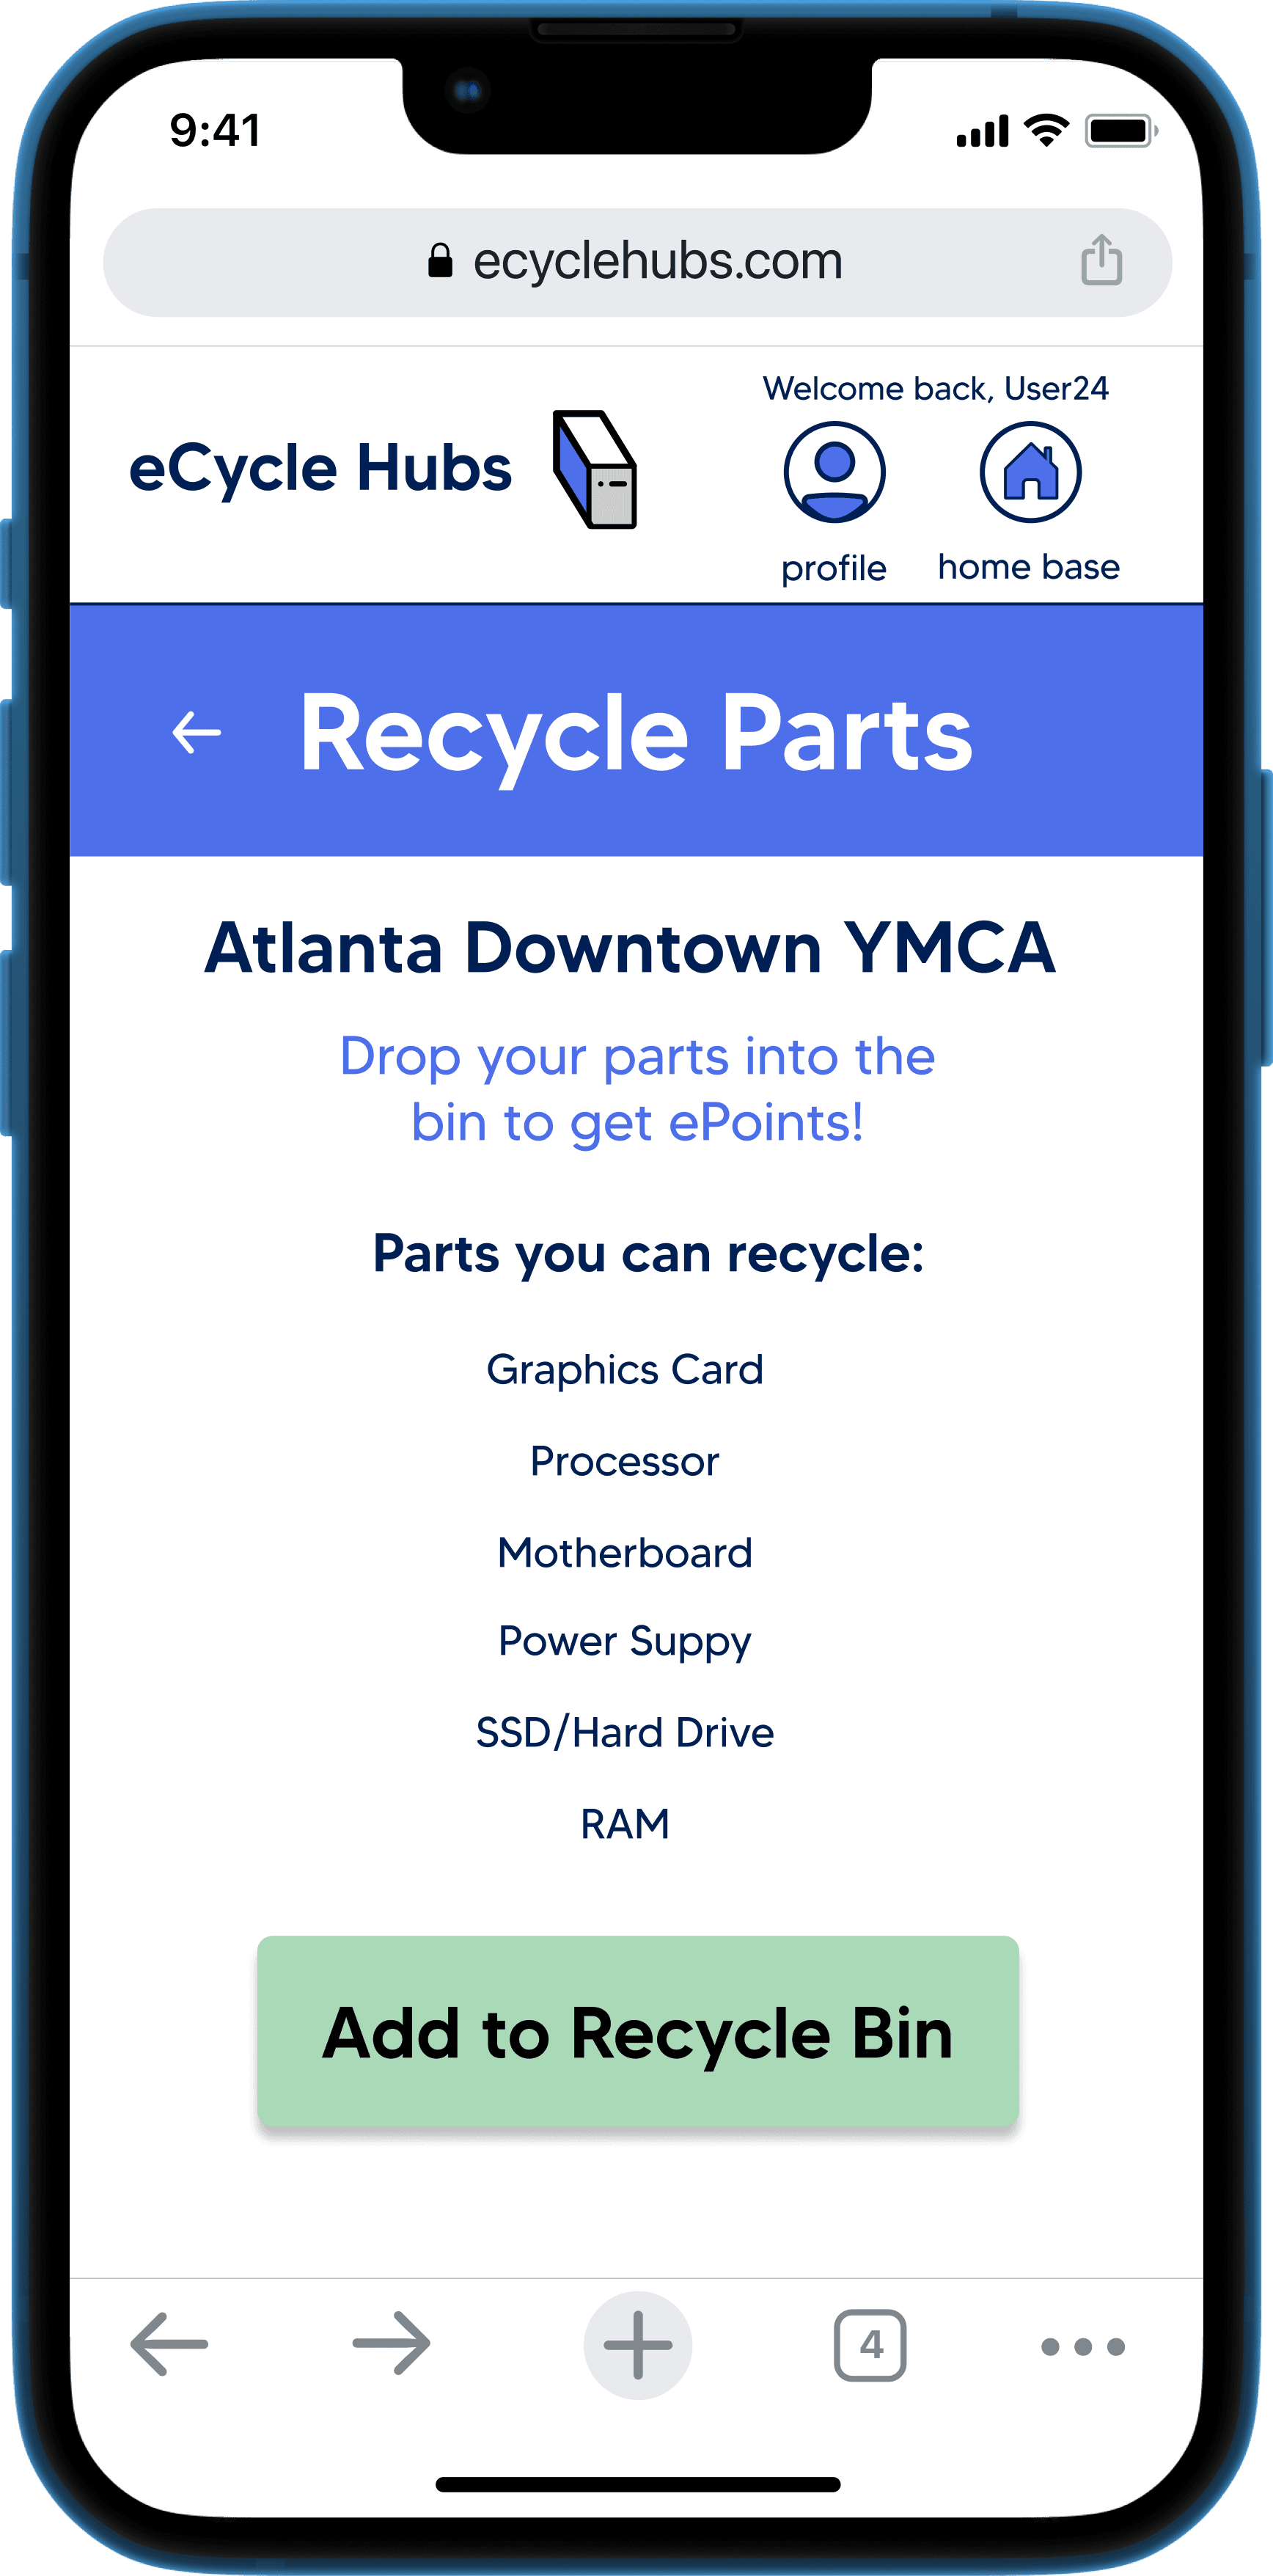
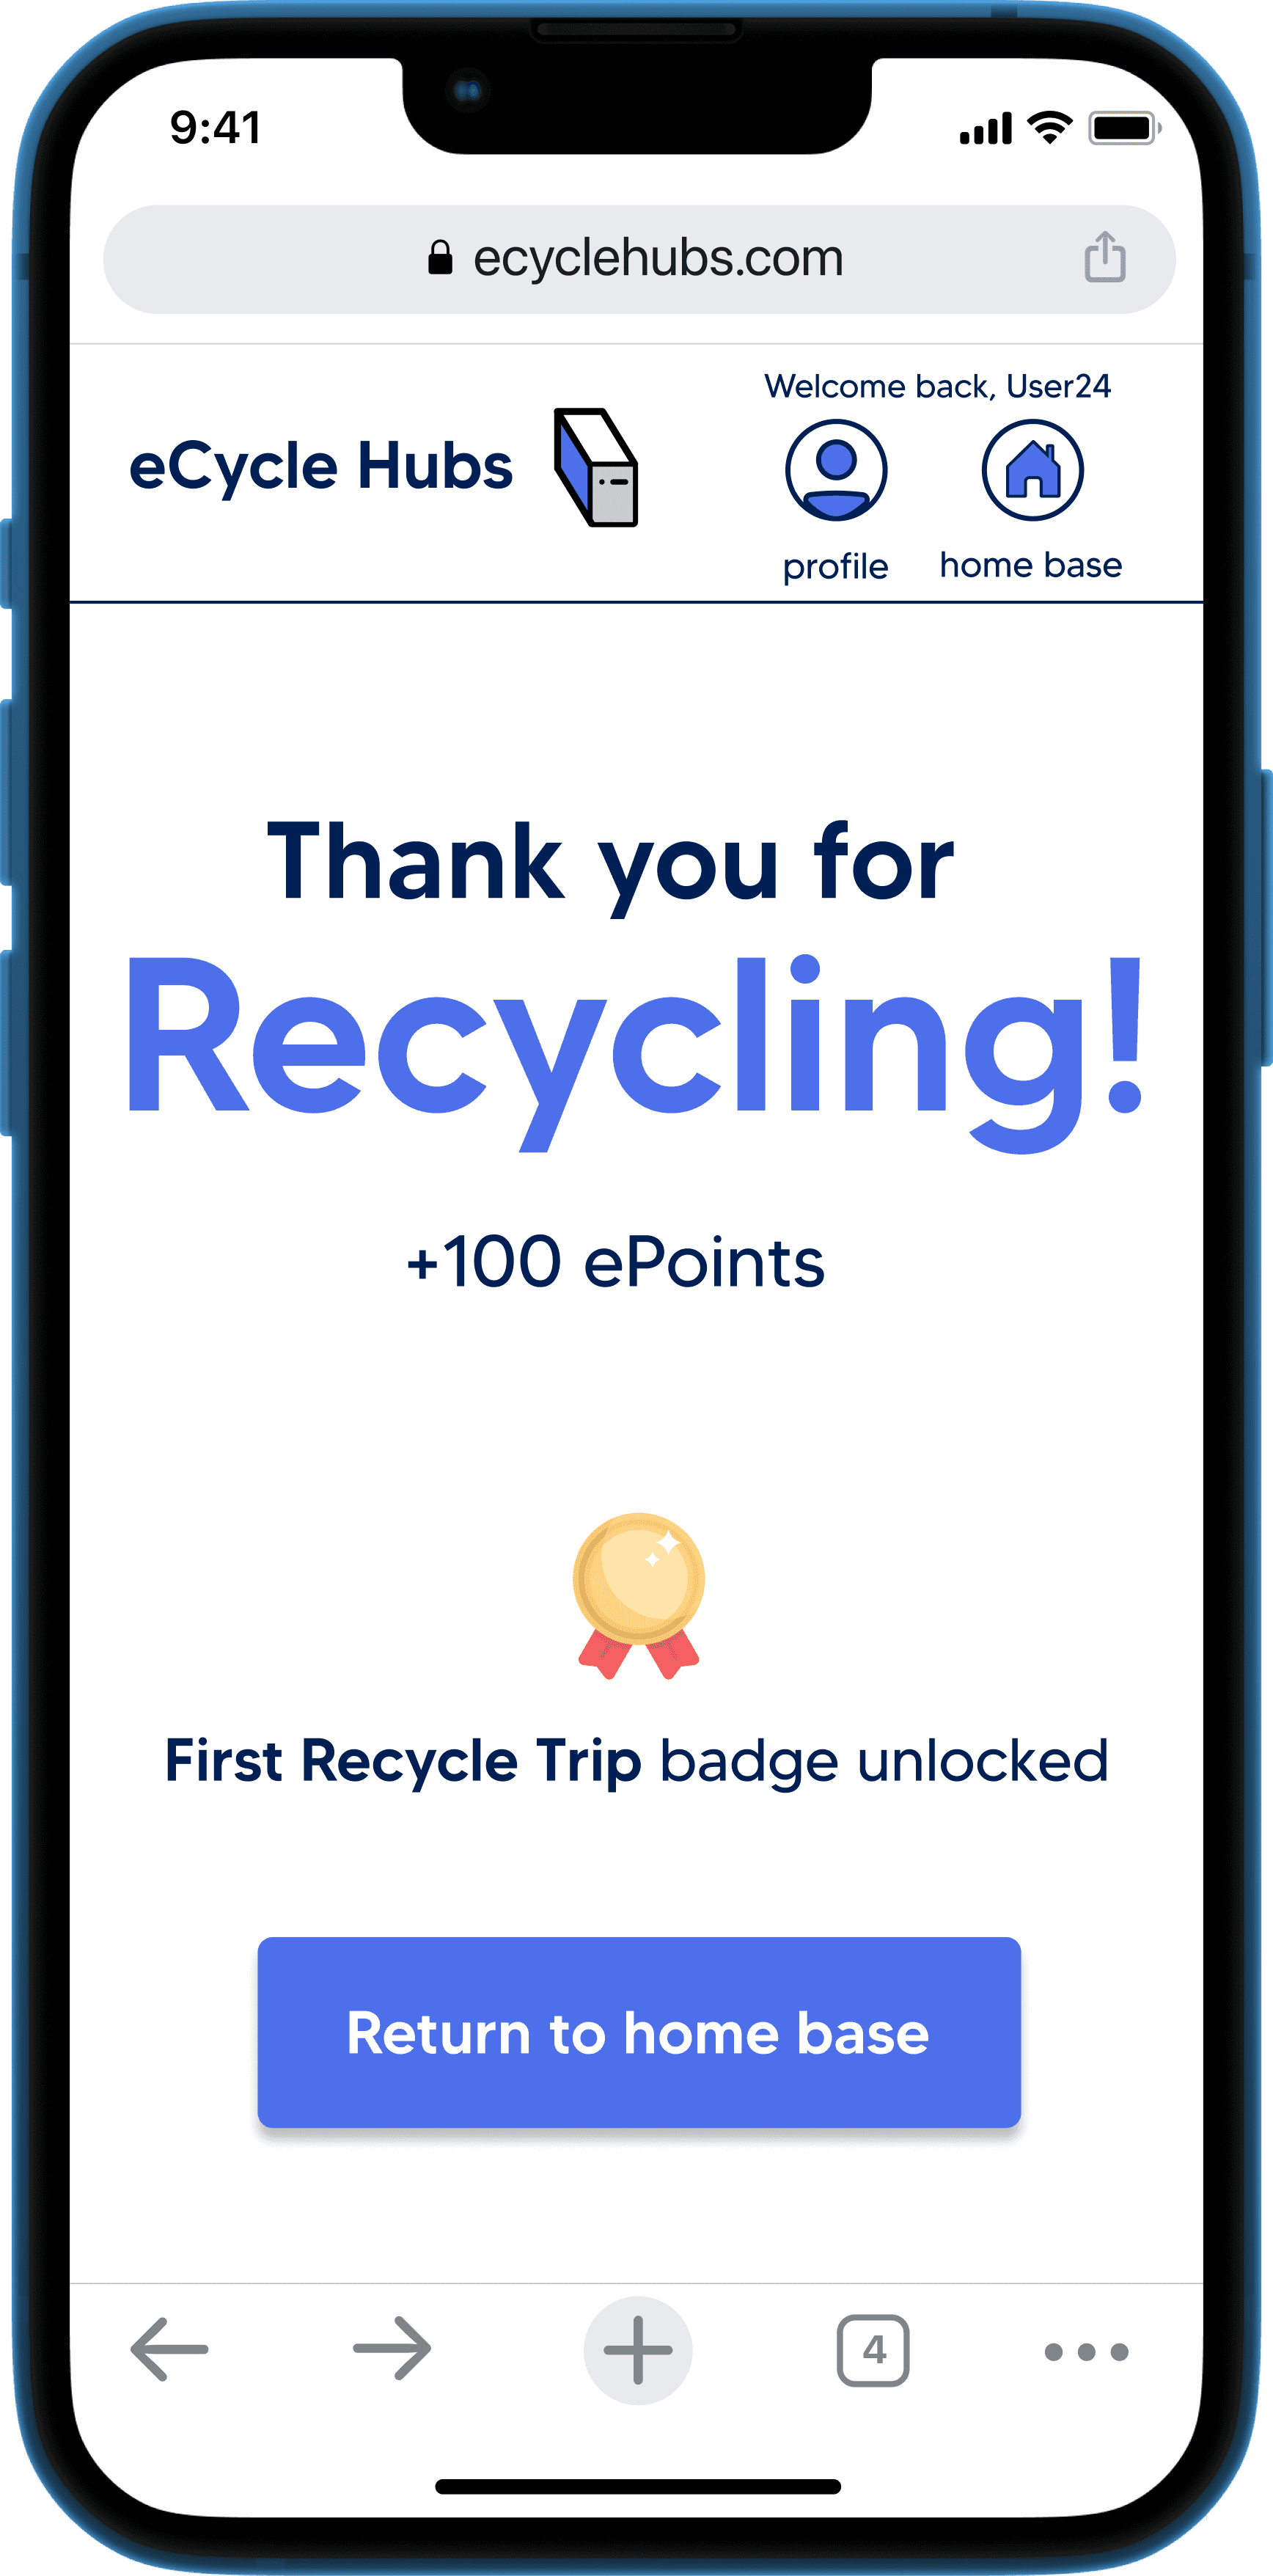
Recycling Walkthrough
The recycling functionality allows users to simply discard non-functioning PC parts into a bin to be properly disposed of. Items that are put into the bin would be picked up by electronic recycling companies and sorted at their individual warehouse. Users gain ePoints when they confirm that an item has been recycled!
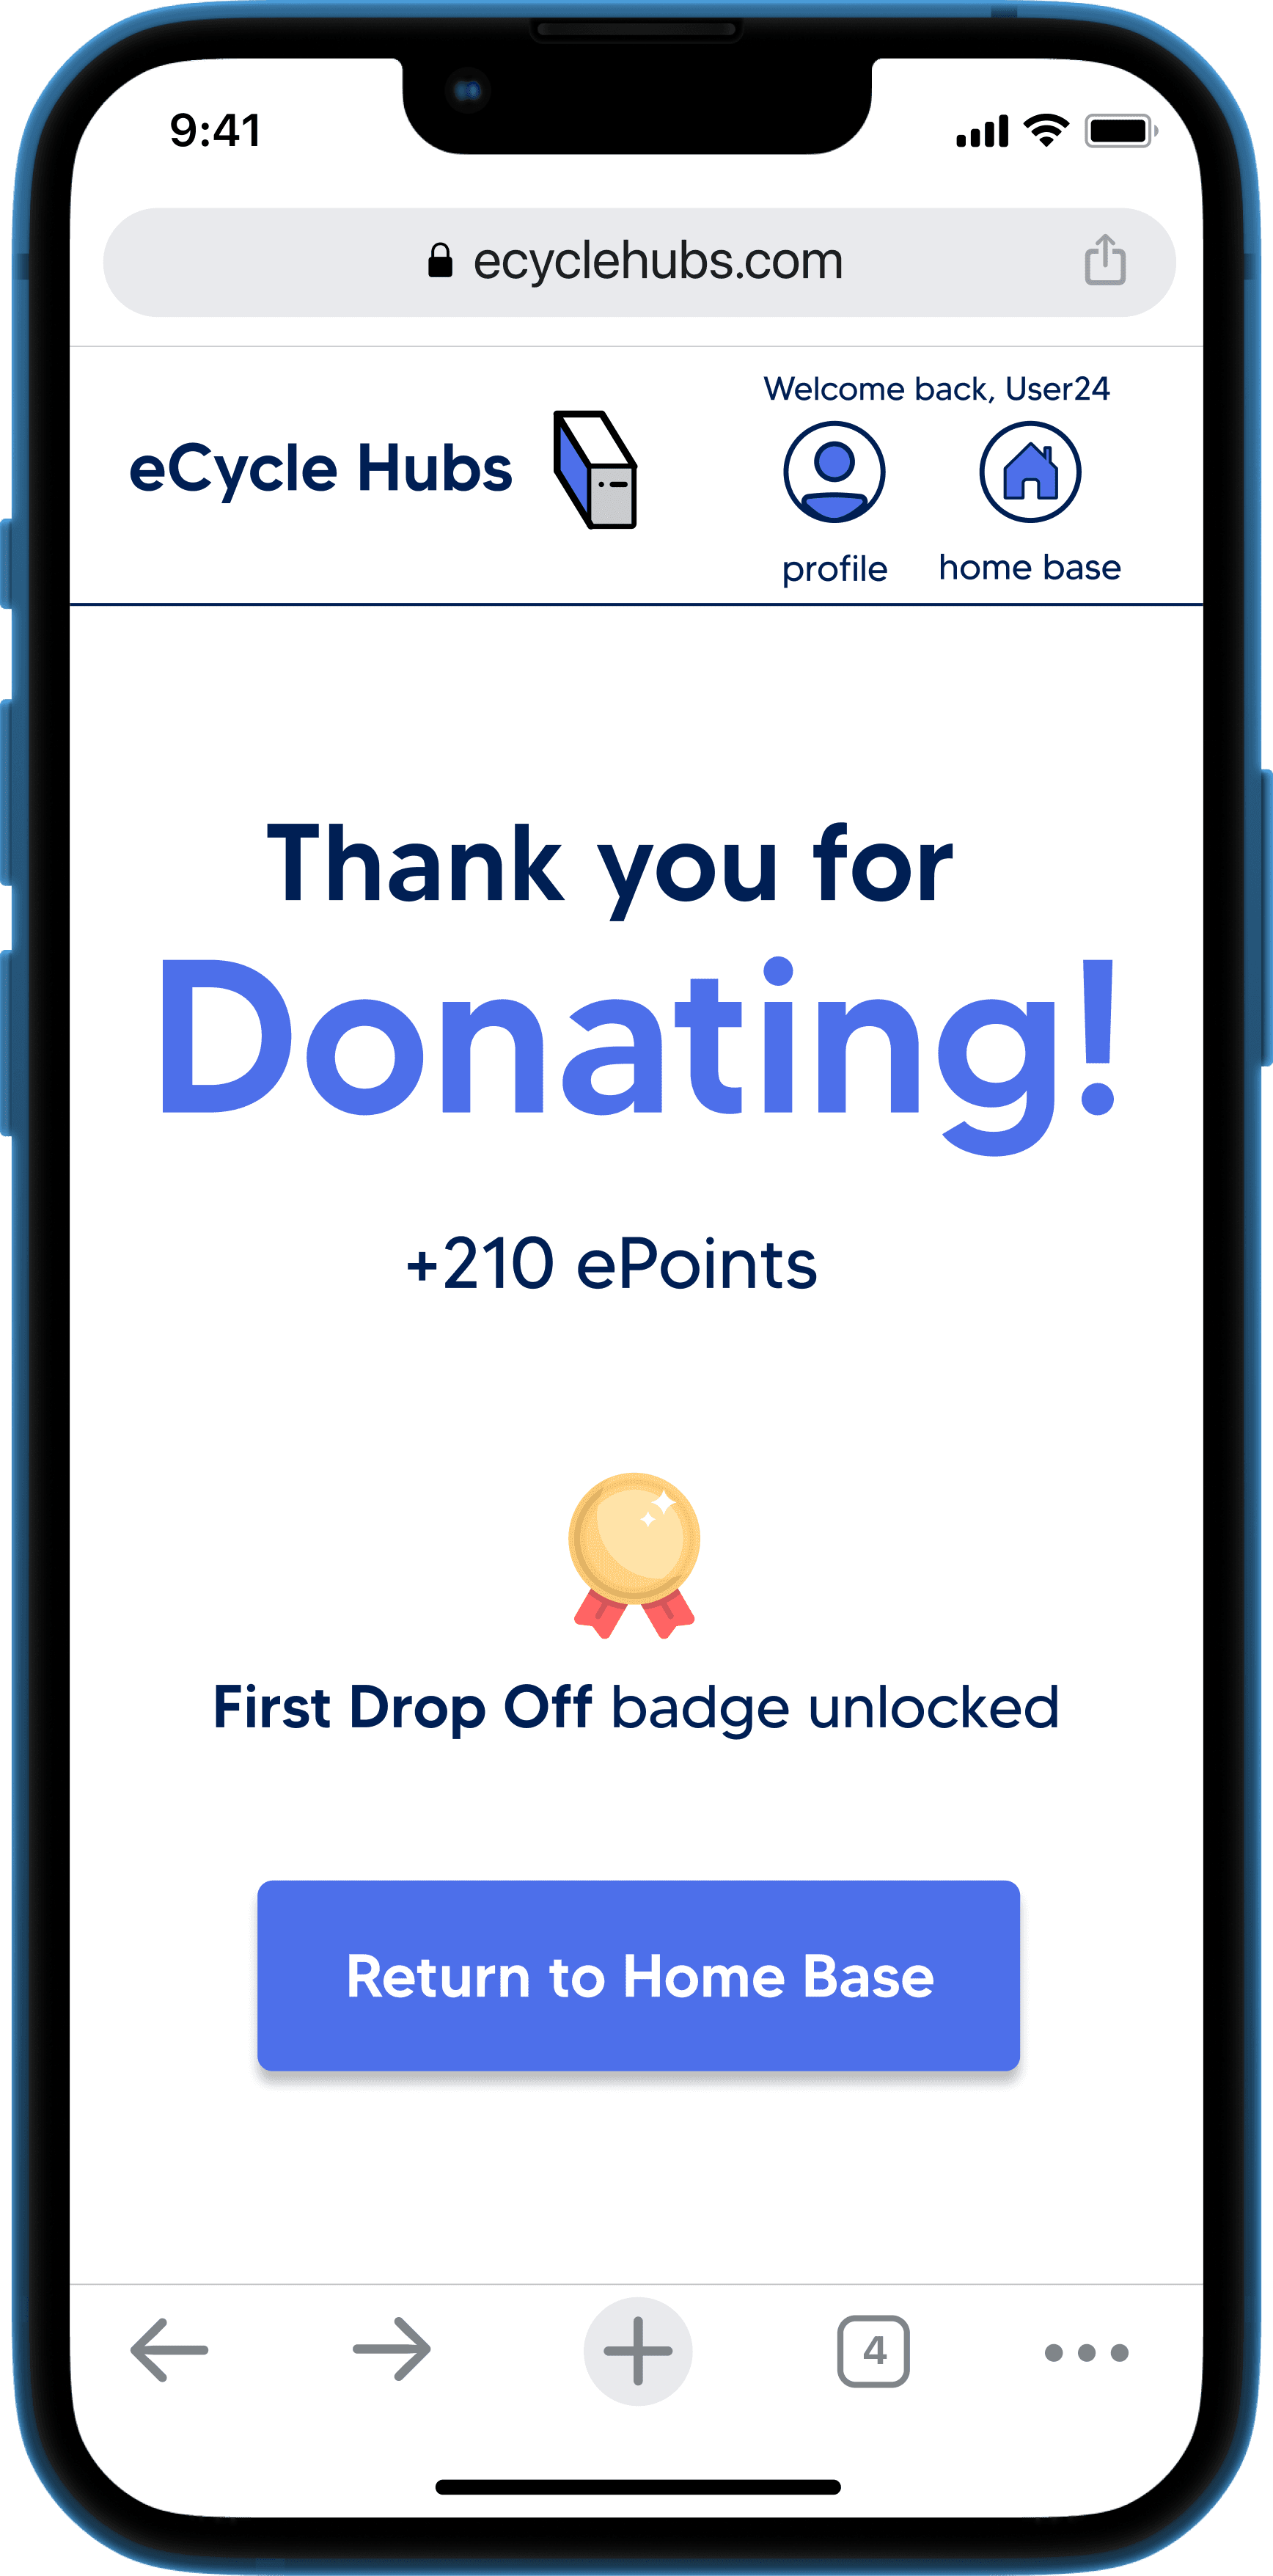
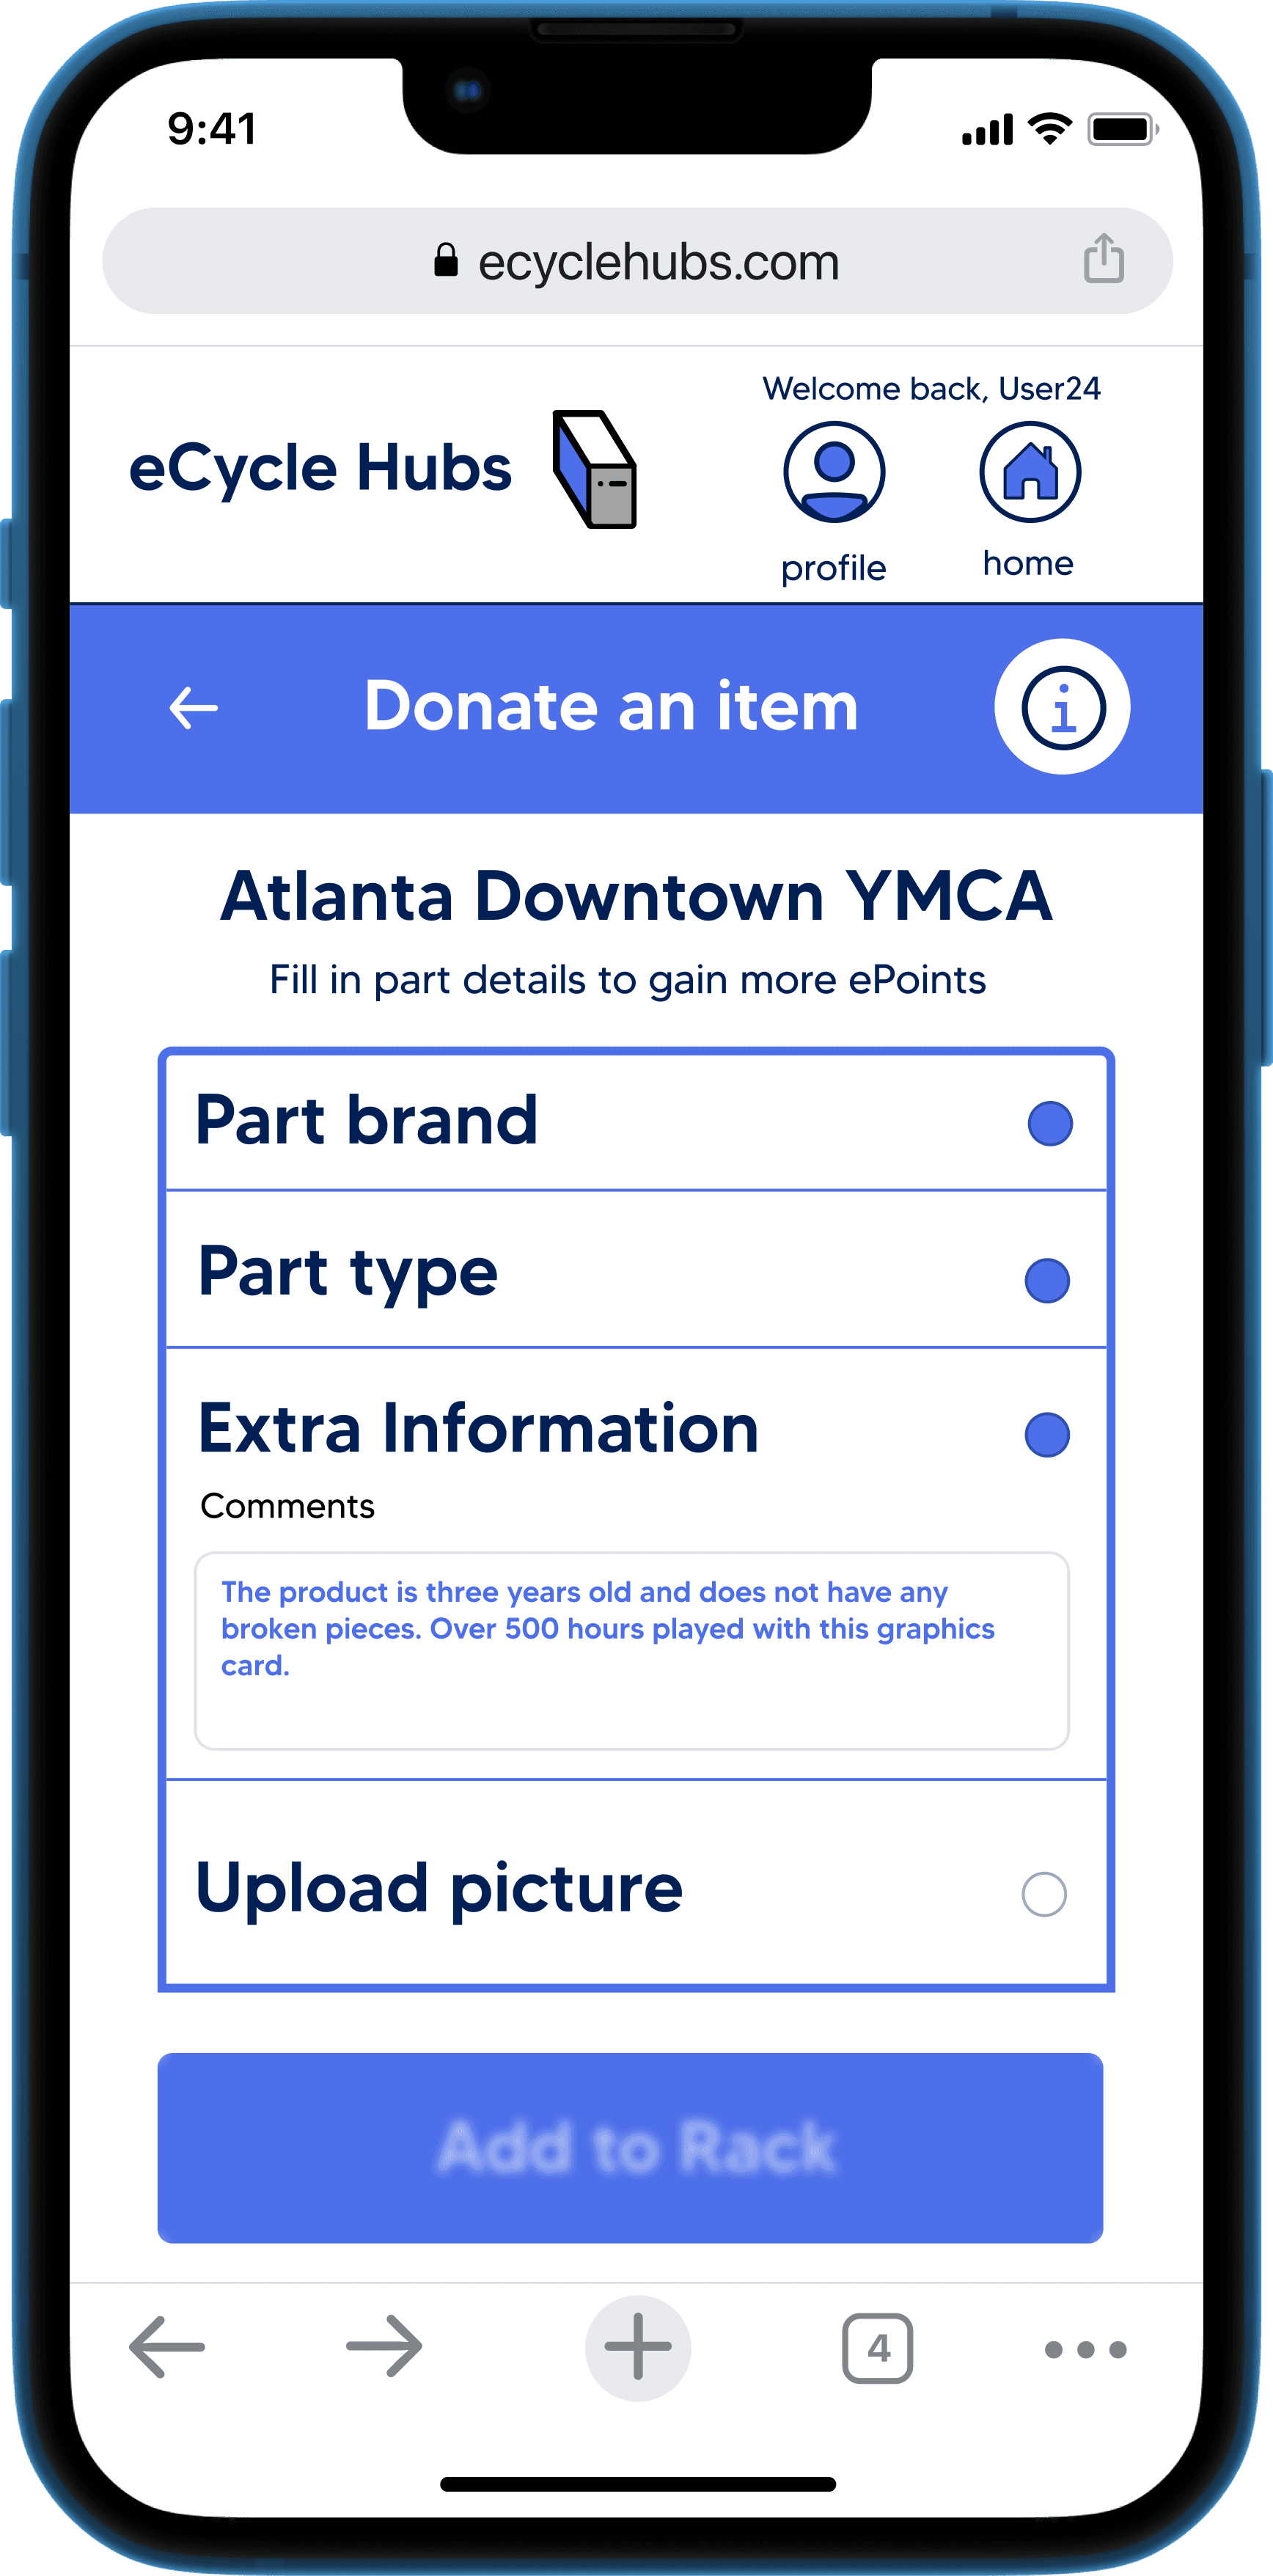
The donating functionality allows users to place unwanted (but still functional) items onto a shelf in the community center for others to come and claim at a later time. Key product data is input by the user who is donating to give an overall understanding of what the item is, the brand, any extra information about it, and what it looks like. Users gain ePoints when they confirm they have placed an item onto the donation shelf!
Donating Walkthrough
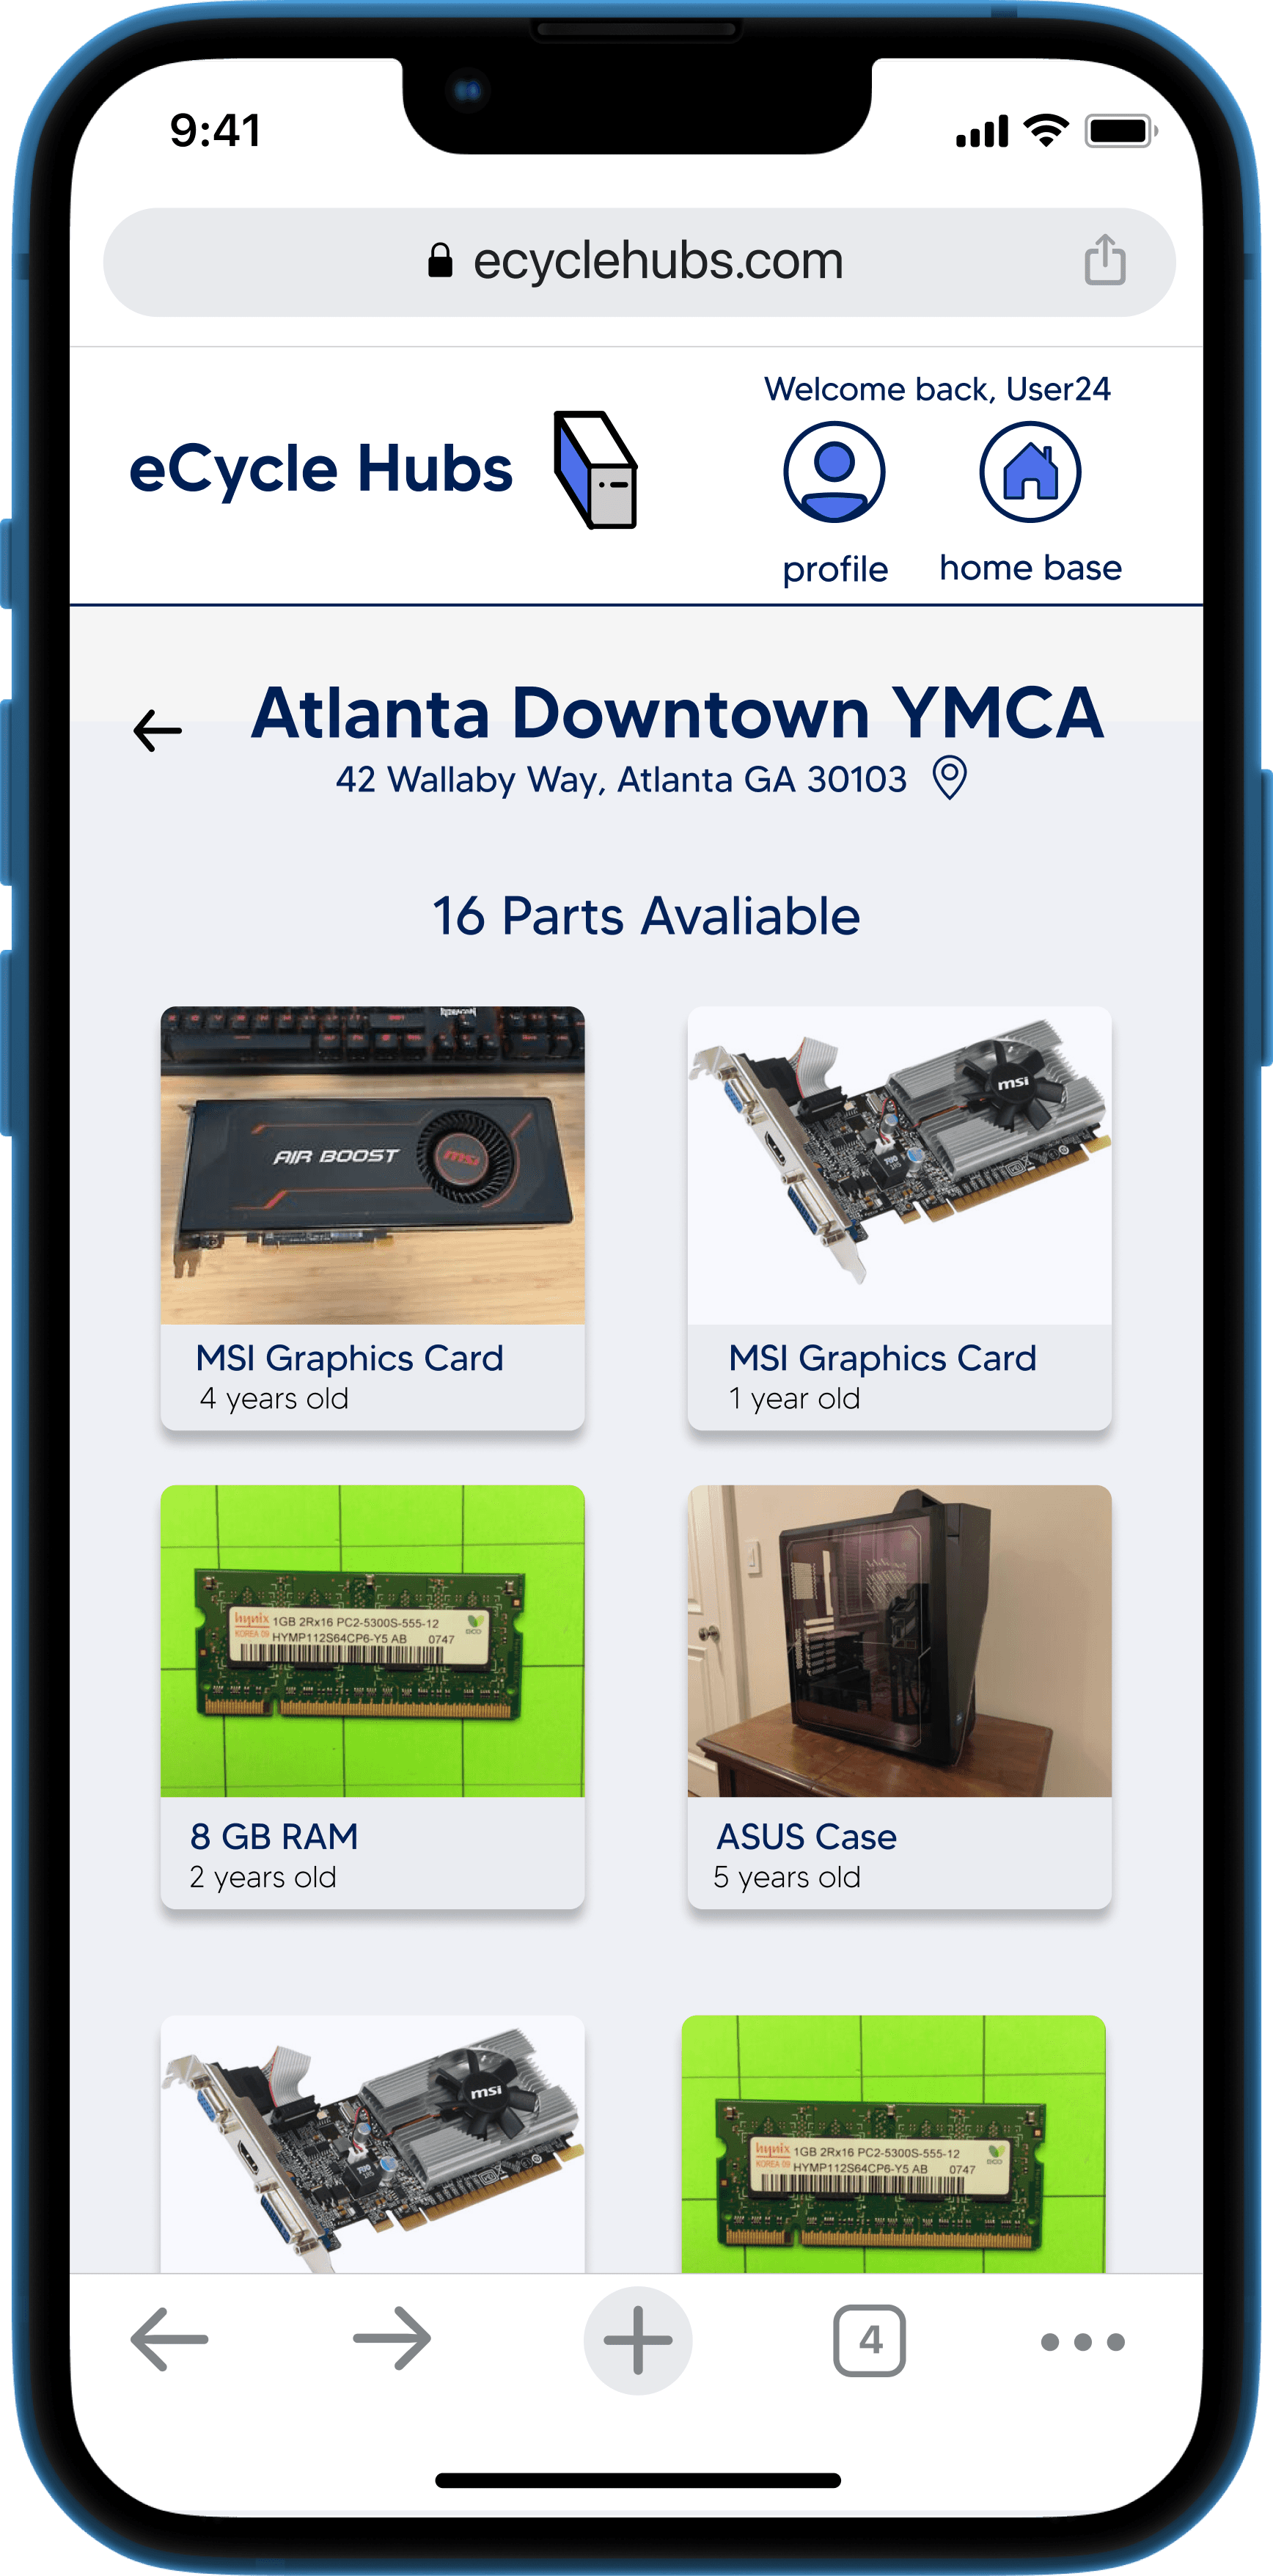
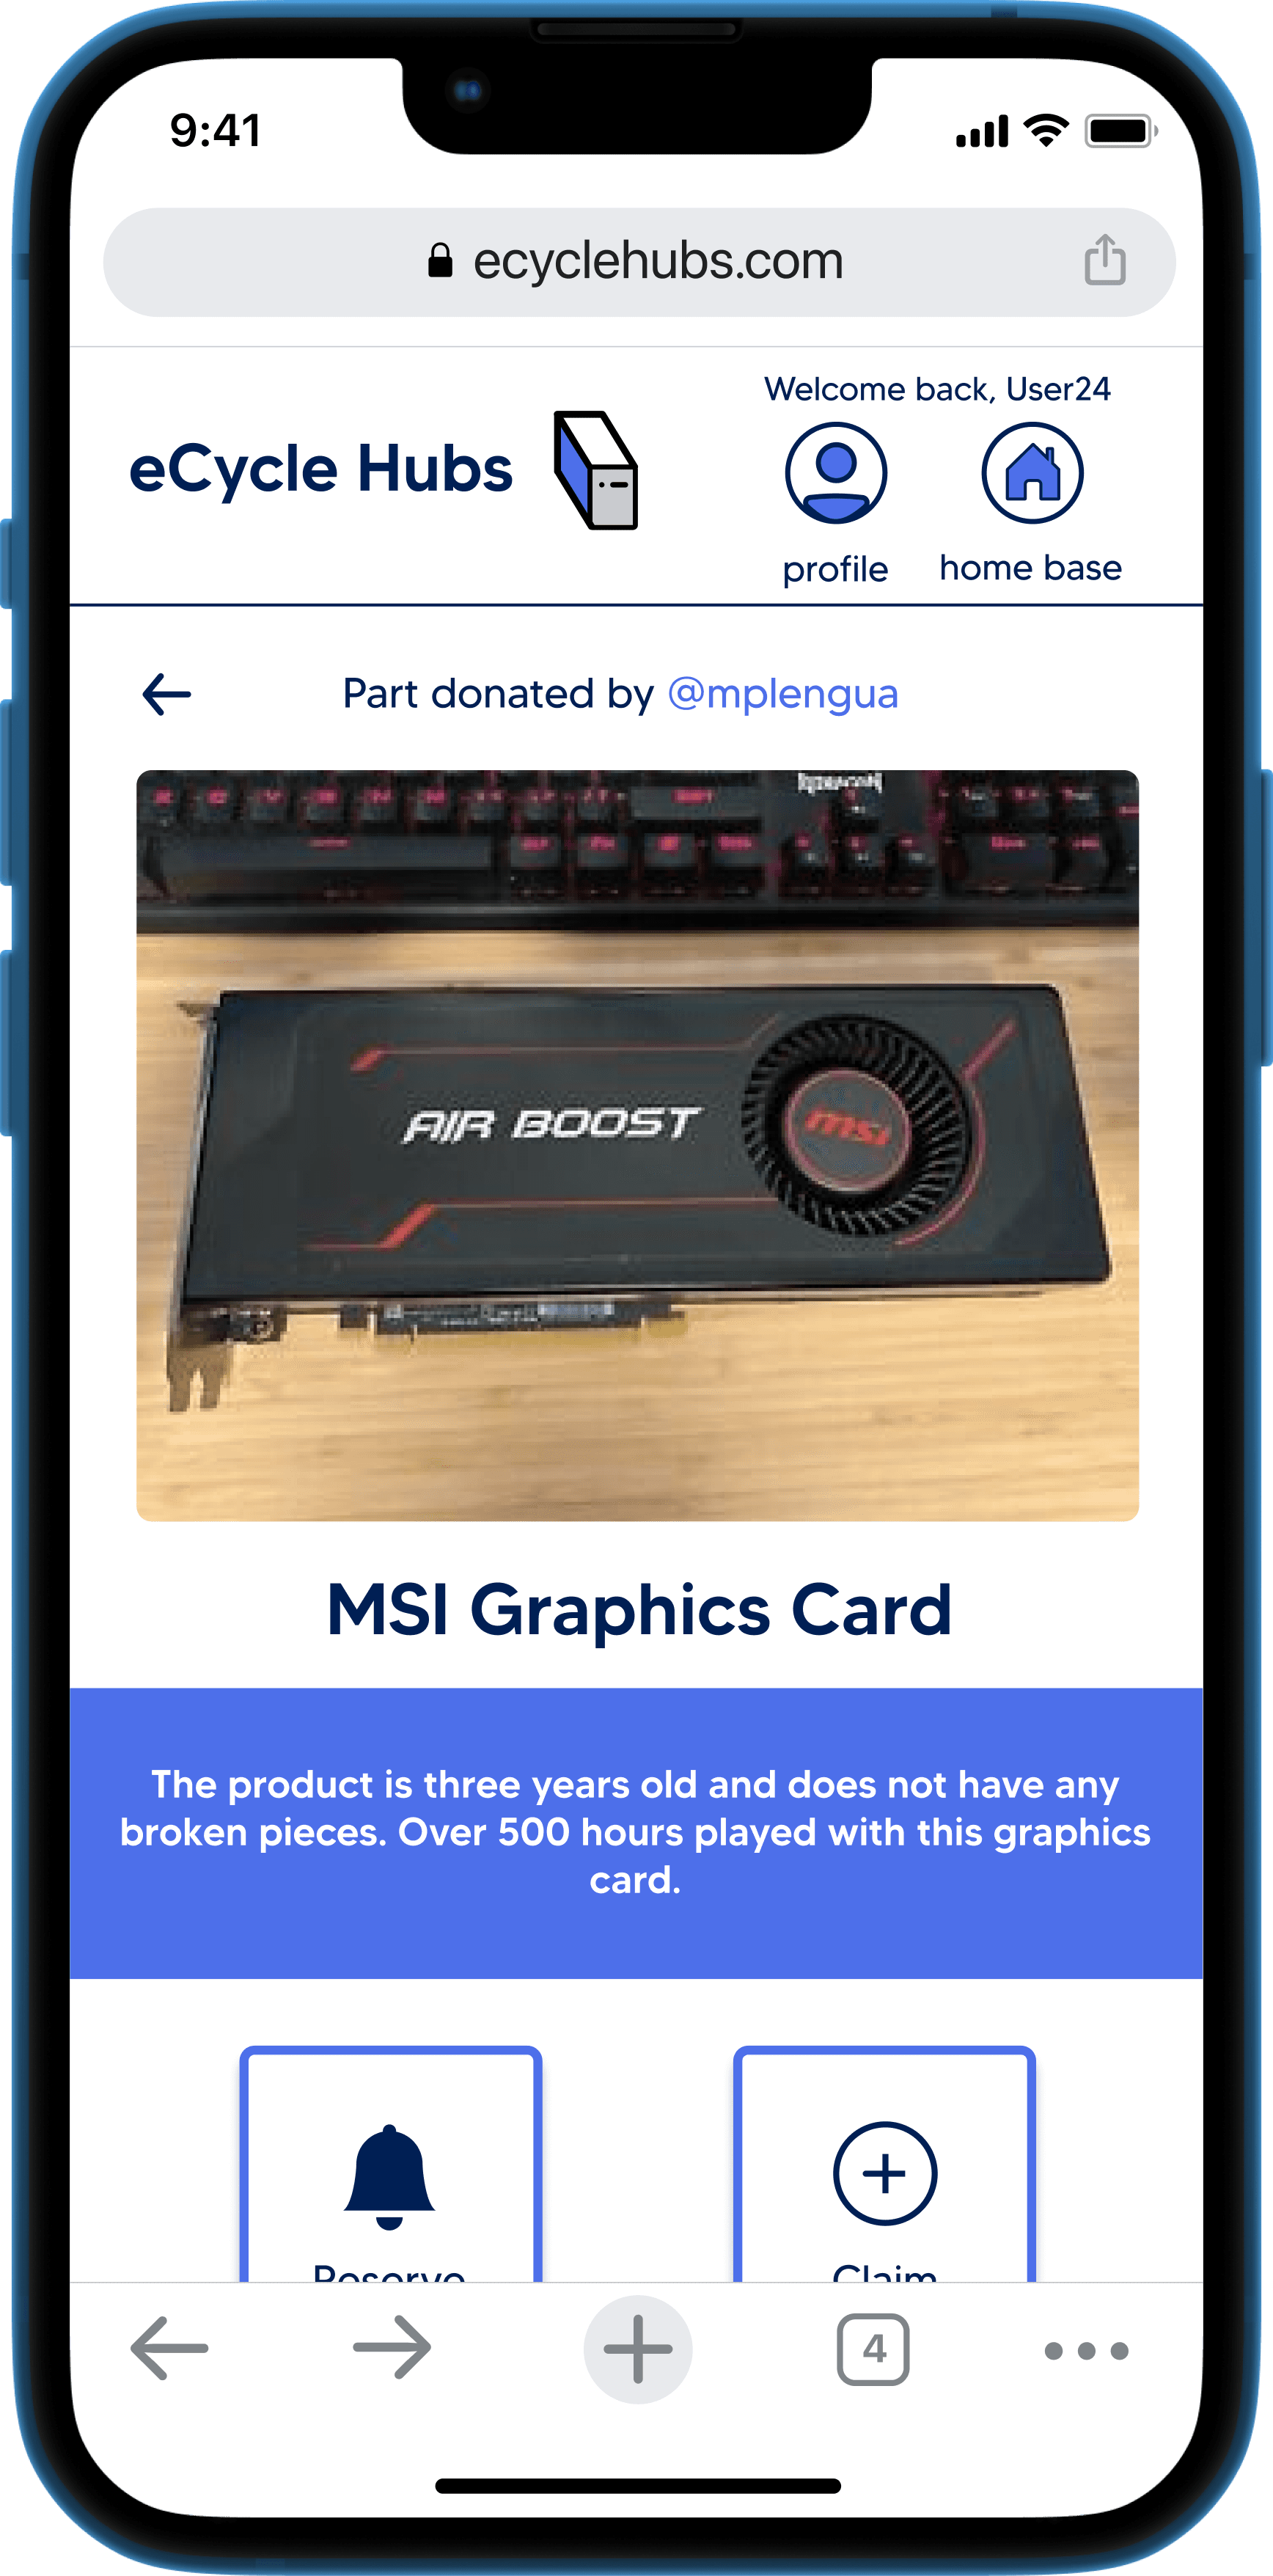
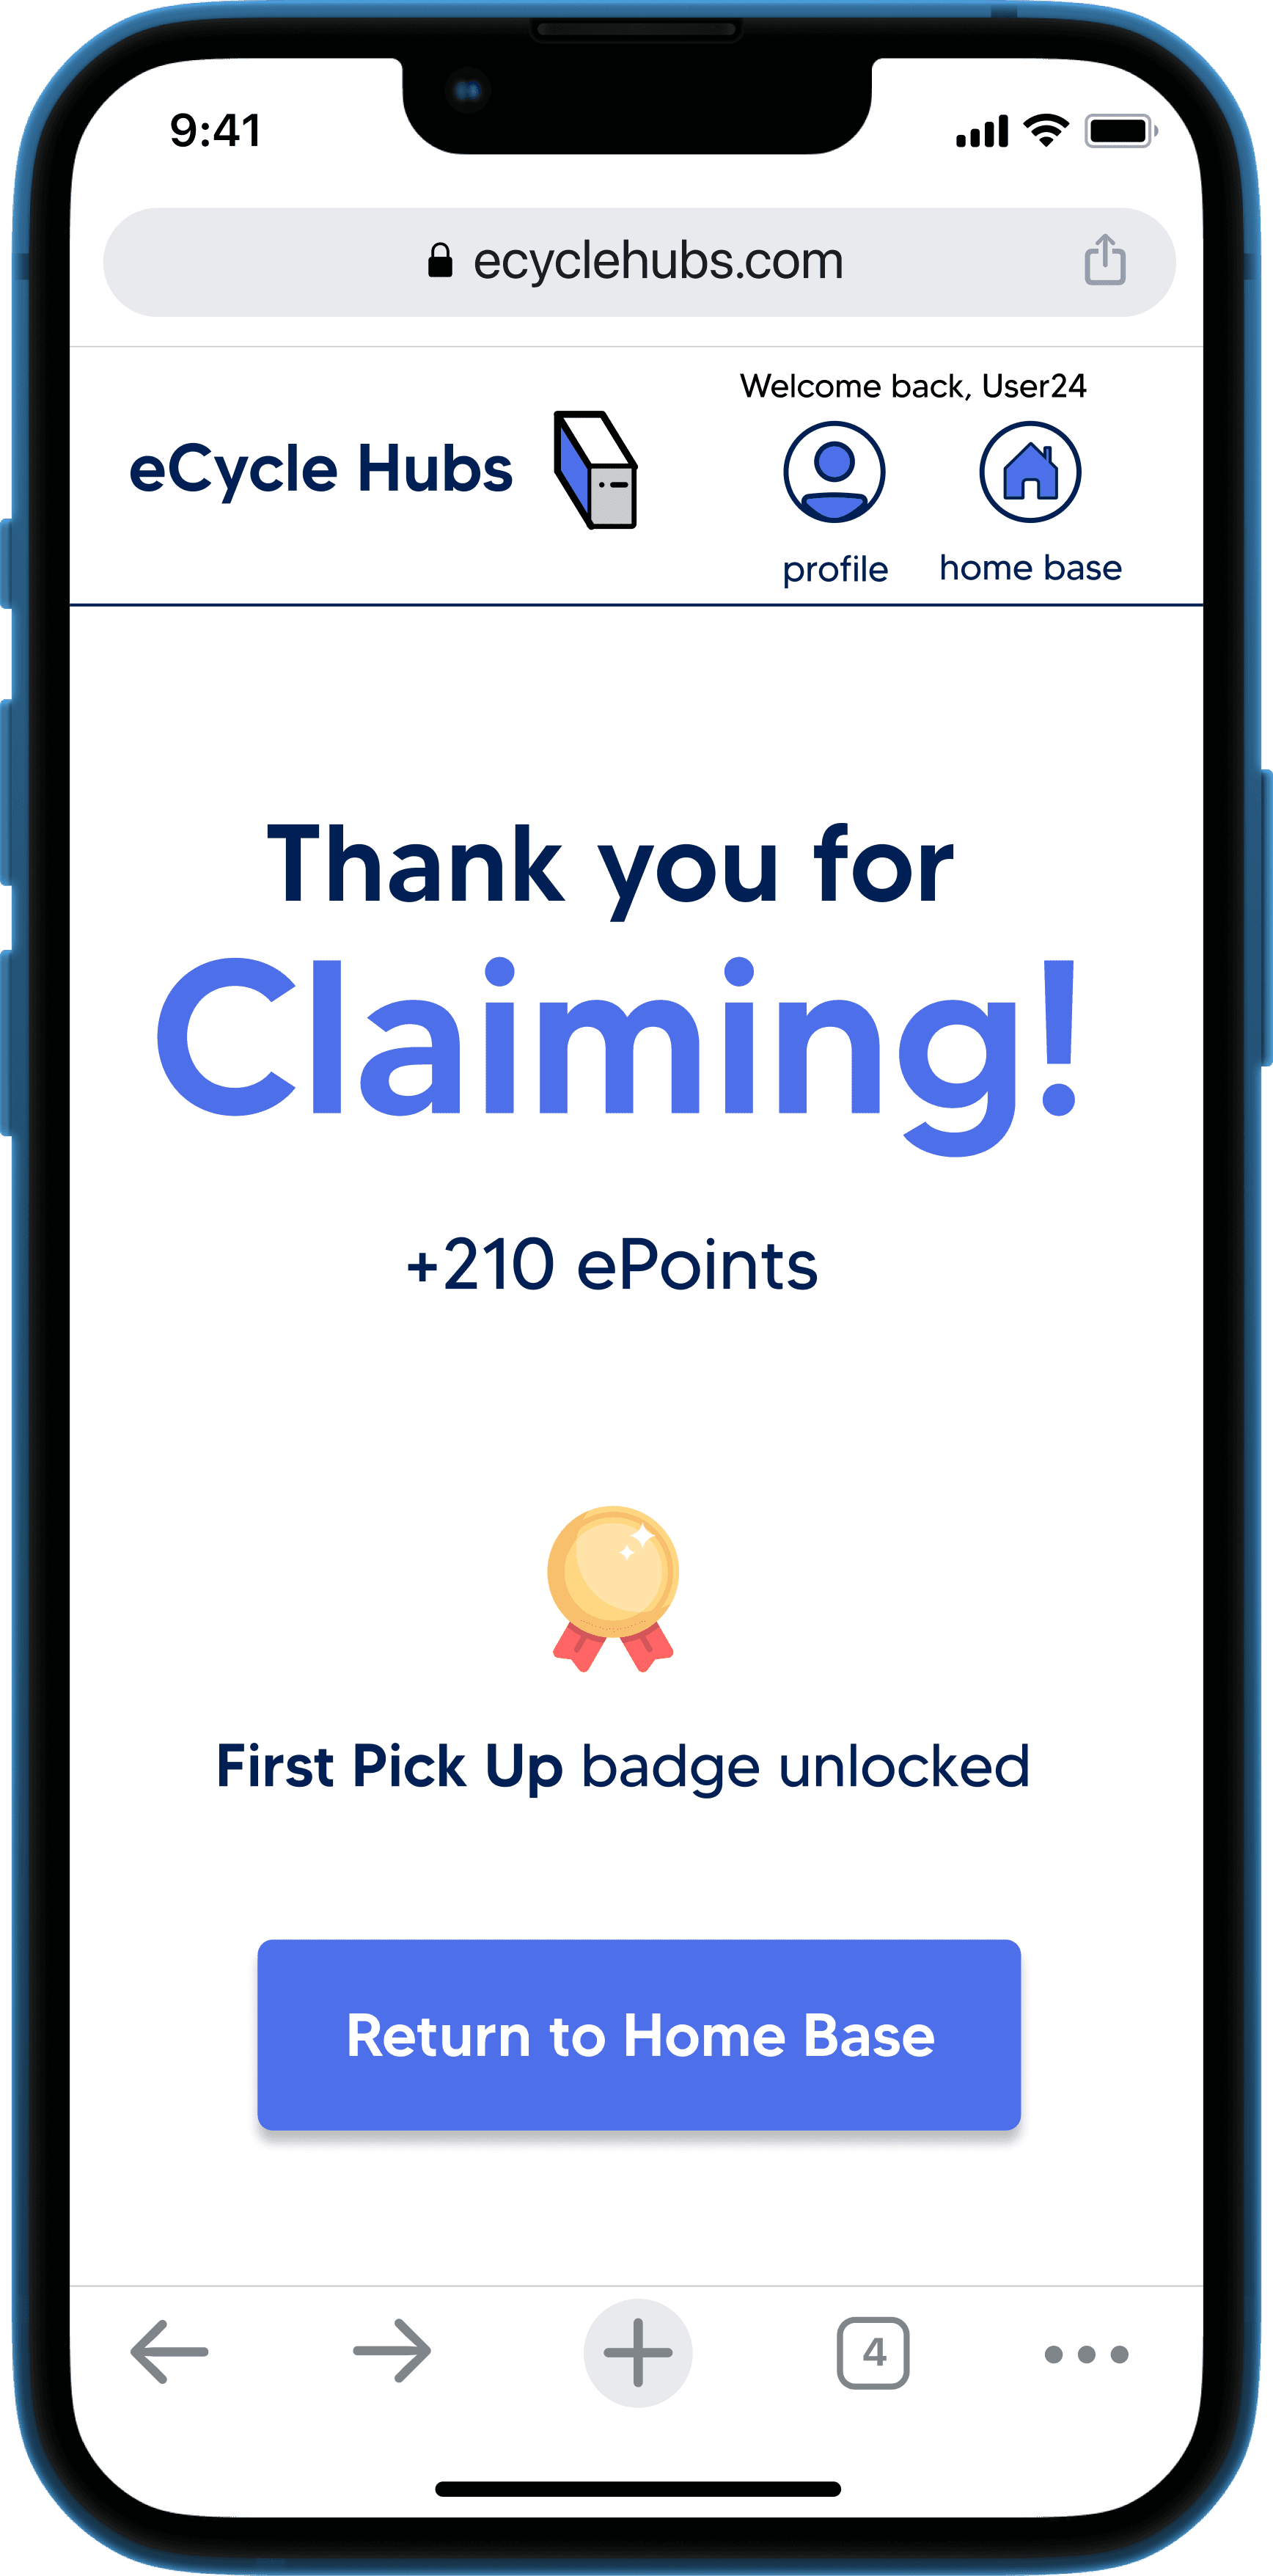
The claiming functionality allows users to pick up parts that have been graciously donated by other eCycle Hubs users. Through a real time inventory tracking system, the web app is able to keep an updated list of items that are currently on the shelf and ready to be claimed. A reservation process is optional if the user is unable to make it to the community center quickly and a 24 hour limit is attached to that specific item. Users gain ePoints when they confirm they have claimed an item!
Claiming Walkthrough
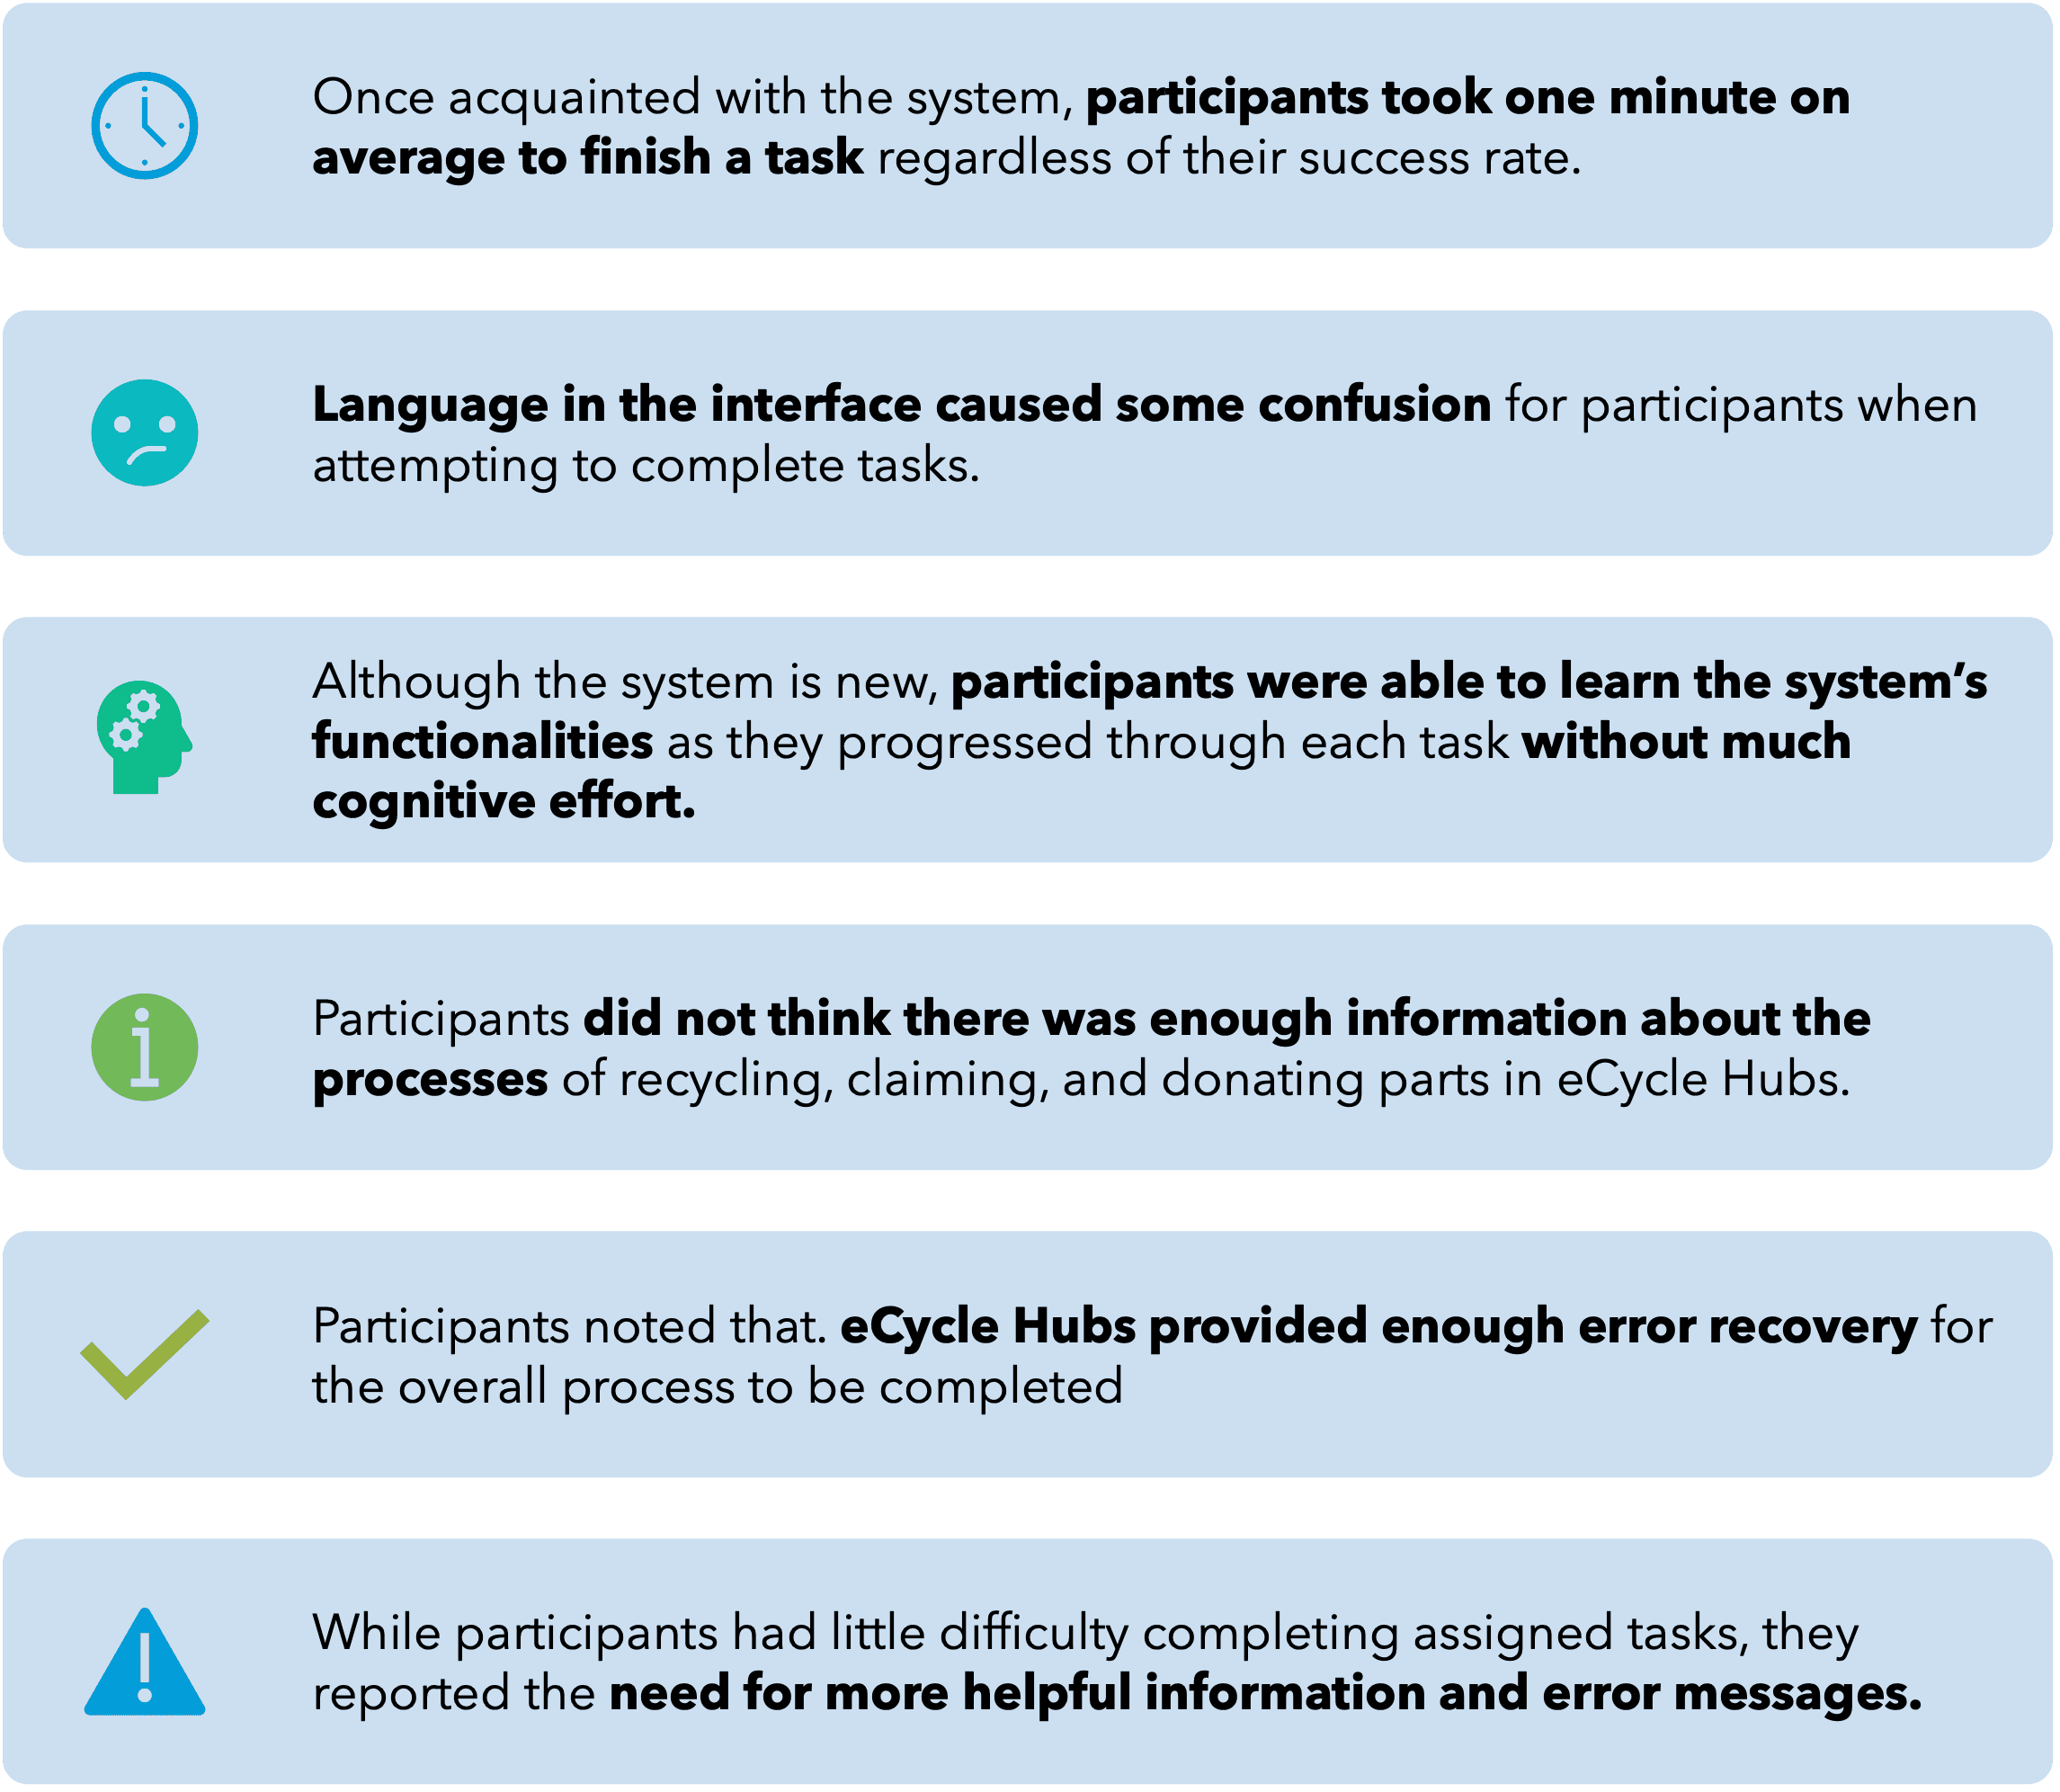
Phase 4: Design evaluation
Evaluation Method Design Requirement #1
“The design should require little time and effort for the user.”
We tested this requirement by performing a usability test with the goal to understand the time and success rate of users going through our prototype.
We gave our participants three core tasks that were pertinent to the core functionality of eCycle Hubs: recycling donating and claiming used items.
Evaluation Method Design Requirement #2
“The design should provide transparency and extensive information. “
We tested this requirement with follow-up questions after the usability test, and we also sent out a Likert scale questionnaire and a heuristic evaluation.
Data analysis
For the first design requirement, we utilized Qualtrics automatic reports to analyze the SUS questionnaire ratings. Also, we compared the completion time and success rates of tasks in an Excel spreadsheet.
For the second design requirement, we used the Qualtrics automatic report system to analyze the responses from the Likert Scale and Heuristic Evaluation. We also identified common themes from follow-up questions responses using an Excel spreadsheet.
Project takeaways
Data is your bestfriend
Data enables you to understand patterns, identify trends, and unlock opportunities, ultimately empowering smarter choices and achieving goals.
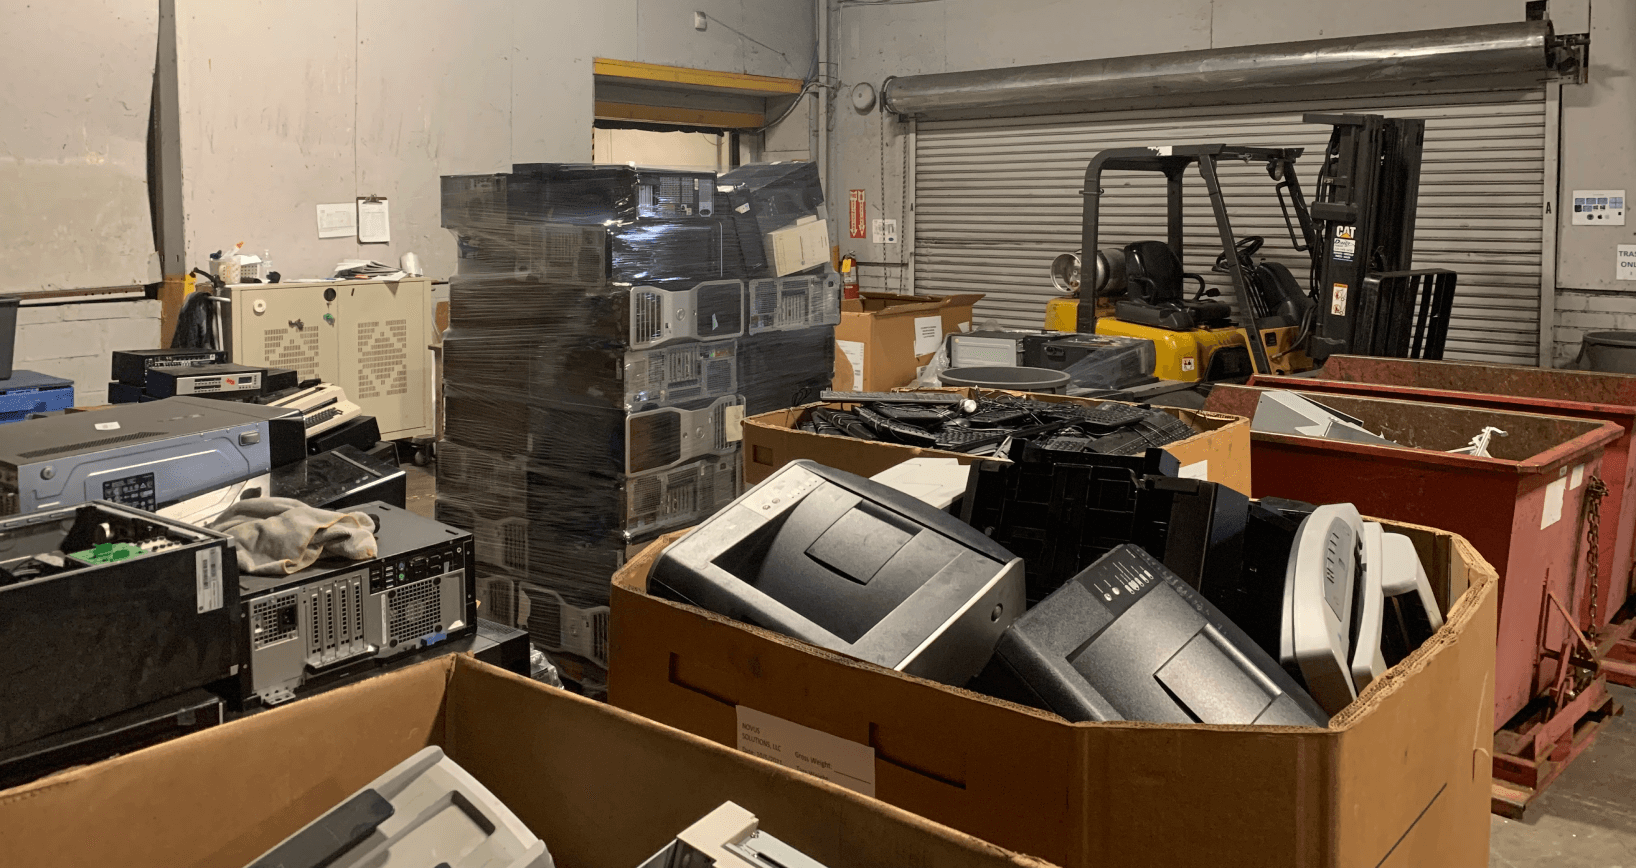
Industry experts are key
By getting to go to a electronics recycling warehouse, we uncovered many biases that we had going into the project. Seeing the process after a part has been recycled was truly amazing.
Have fun with design
Think outside the box. The key is to enjoy the process, let your imagination soar, and see where your design journey takes you.